
Defense may improve by default if OU and OSU take a step back. Each of those were flat out elite last fall.
Photo by Todd Nickle
Baylor Football
Big 12 offenses were good in 2017, but how good will they be this season?
The Big 12 is known for wide open offense and most years will live up to that reputation. Last season was a year where the Big 12 had a little of everything on that side of the ball. How did each team perform in 2017 and what can we anticipate for 2018? Below we will dive into a couple metrics that I tend to look at with each school.
Previous: Does the Big 12 play defense?
Yards Per Drive
Yards is an old reliable statistic for many but total yards can be biased based on how many plays or drives a team runs. Similarly yards per play can bias towards teams with wide open offensive schemes and punish teams like Air Force that rarely struggle to move the ball per-drive but rarely break really long plays. So how did each team's offense do?
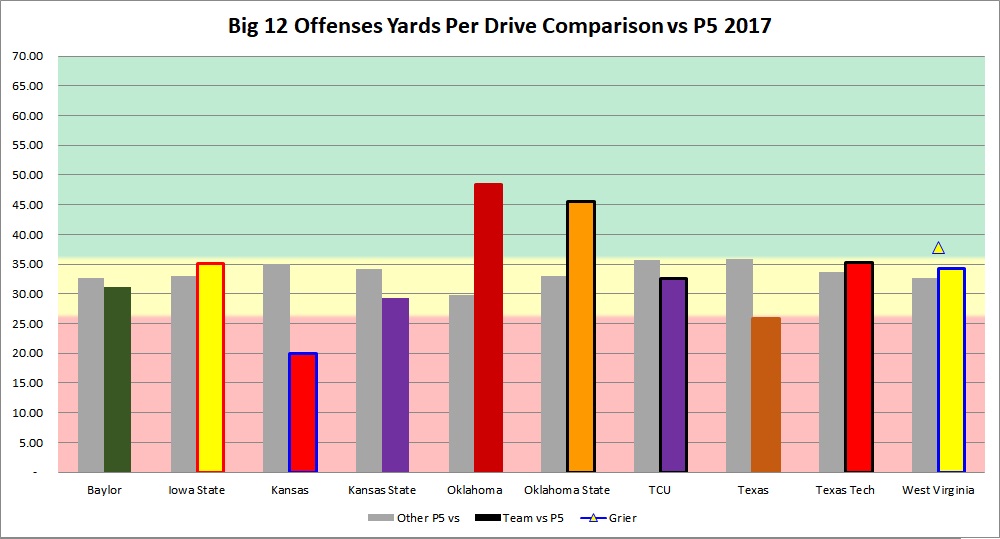
I have two ways of answering that. First I have the average of their YPD from each P5 game compared against "par" which is also known as what the other eight or more P5 offenses averaged against those defenses. Not all opposing schedules challenge an offense as much as others. This tells you how a team did relative to it's schedule. P5 opponents are used so that at least a handful of solid offenses and defenses provide a reasonable comparison number.
I also have the background shaded red, yellow and green. Yellow starts roughly where a median national figure or an average national figure end up being; roughly 31 yards per drive. From there it's plus or minus five yards. Assuming a 12-possession game you would have a yardage swing of at least 60 total yards from typical if you fall outside this range. Green is better than five from typical, red is worse than five from there. This tells you if their YPD is good, mediocre, or bad as a stand alone statistic.
The gray bars are each team's "par" while the colored bars are each team. So what did each team do? (Note: I added WVU's full games with Will Grier as a gold & blue triangle overlayed on this chart as his injury dramatically changed that offense. Their "par" with and without Grier changed by 1/4 of a yard.)
The best performers here are clearly Oklahoma (+19 YPD vs par) and Oklahoma State (+12.5 YPD vs Par) followed by WVU with Will Grier in the lineup (+5 YPD vs Par) averaging 115% of what teams usually give up to other P5's. The next best is the very underrated Iowa State offense (+2 YPD vs Par) that comes in about a yard lower than they would be had I isolated Kyle Kempt's games (+3.3 vs Par). The Red Raiders are next up with +1.6 vs par. Everyone else was below par overall although two other teams outperformed par with specific quarterbacks in the lineup. Half of the league was above par but 70 percent had at least one high performing lineup.
The worst offense is by far Kansas who was negative 15 YPD vs par. Between an unsettled QB situation and losing two of their key linemen for a handful of games, the Jayhawks were grounded despite having two really good weapons in Sims and Herbert. The next worst in yardage was Texas who had some injuries and youth at QB in a new system. KSU and TCU were close to national median overall but below par by 5 and 3 yards roughly.
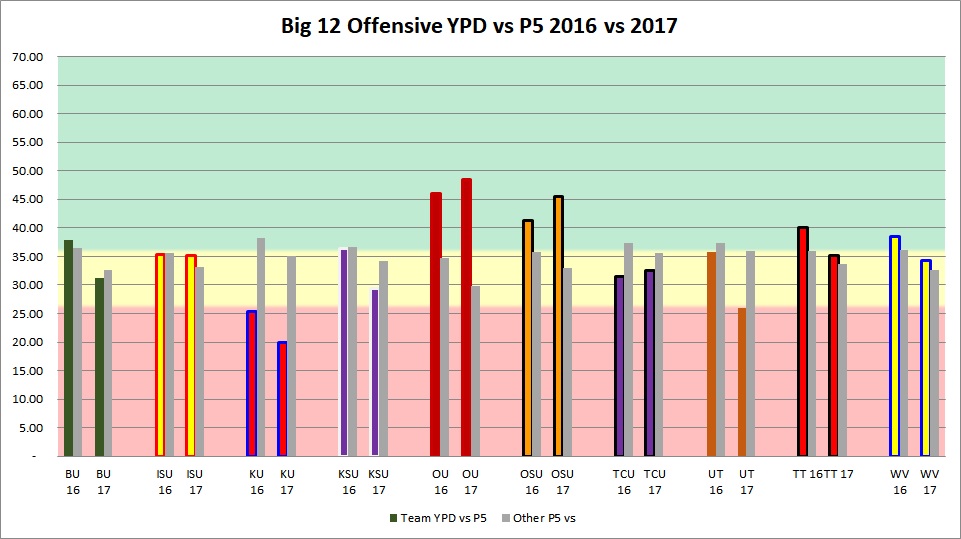
Let's compare this to 2016 for each squad.
- Baylor obviously regressed due to a revolving door of injuries. Although Charlie Brewer was above par.
- Iowa State stayed level in YPD but faced tougher defenses than the year before. The ISU offense has been strong each year and is an overlooked portion of Campbell's turnaround.
- Kansas and KSU got worse than the prior year.
- Oklahoma and Oklahoma St. improved in yards per drive but massively improved vs par.
- TCU improved 10% vs par and a slight amount in raw YPD.
- Texas fell off to a big degree with significant changes on the line and with their scheme. They regressed after improving significantly in 2016.
- Texas Tech remained above par but wasn't as strong without Mahomes.
- West Virginia faced tougher defenses but averaged fewer yards than 2016 with Skyler Howard which surprised me.
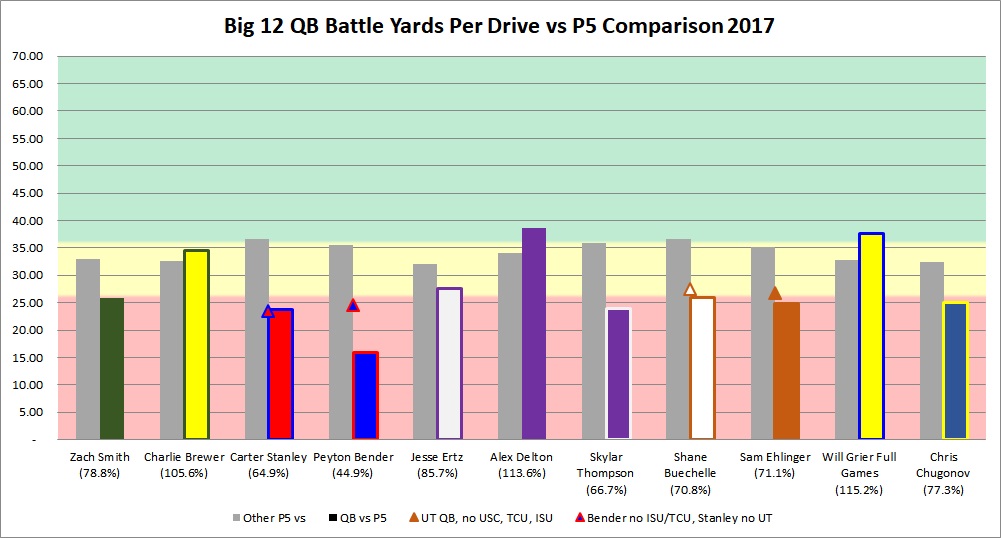
How did different quarterback lineups affect this? During 2017 you saw Baylor, Kansas, KSU, Texas, and WVU face several games with different QB's under center. Below is how each did vs par.
- Baylor returned to it's 2016 yardage vs par with Brewer under center but really struggled with pocket passer Zach Smith behind a very injured line.
- Kansas struggled with both quarterbacks but Bender's average is weighed down by facing TCU and Iowa State during the offensive line injuries. His YPD is on par with Stanley outside of those games.
- Kansas State was below par with Ertz (-5), dramatically below it with Thompson (-12), and above it with Alex Delton (+4.6). Depending on who your team faced, they faced a different KSU offense production wise. I was surprised Ertz dropped so much after a better performance as the 2016 starter.
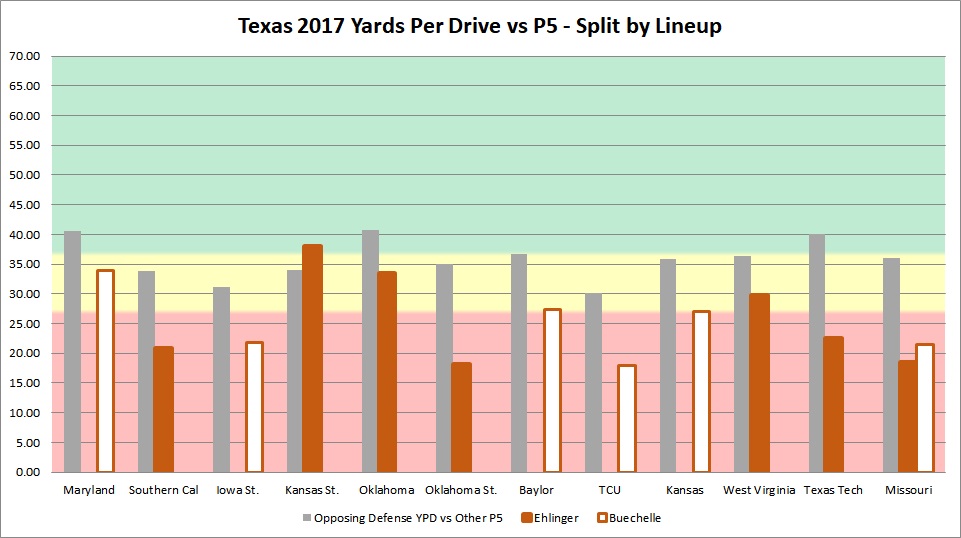
- Texas was virtually the same in yards per drive with both quarterbacks averaging 71% of par and finishing 10 YPD below par. The two are still virtually even when the best three defenses (TCU, ISU, USC) are omitted.
- West Virginia was a great offense with Will Grier (+5) and a bad one without him. (-7.4)
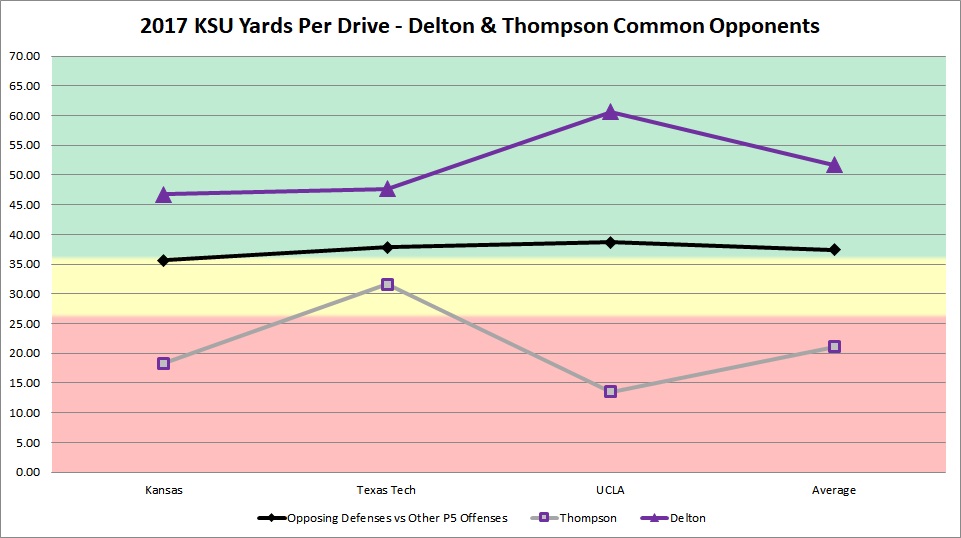
Below is some additional detail for KSU and Texas as I covered the Baylor offense in another article.
KSU's common opponents for Delton and Thompson really drive home how different they performed last year. Delton significantly outperformed Thompson even before his 60 yard per drive stomping of UCLA.
Here's additional detail for UT vs par for each quarterback. The only game above par was Ehlinger vs KSU and both players struggled throughout the season. The only common opponent where each had more than two drives was Missouri.
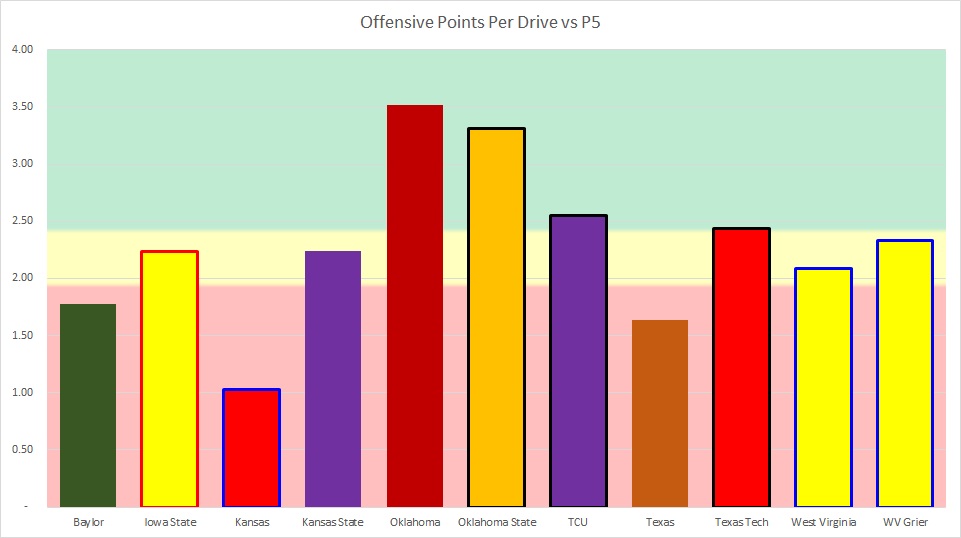
Red Zone Points
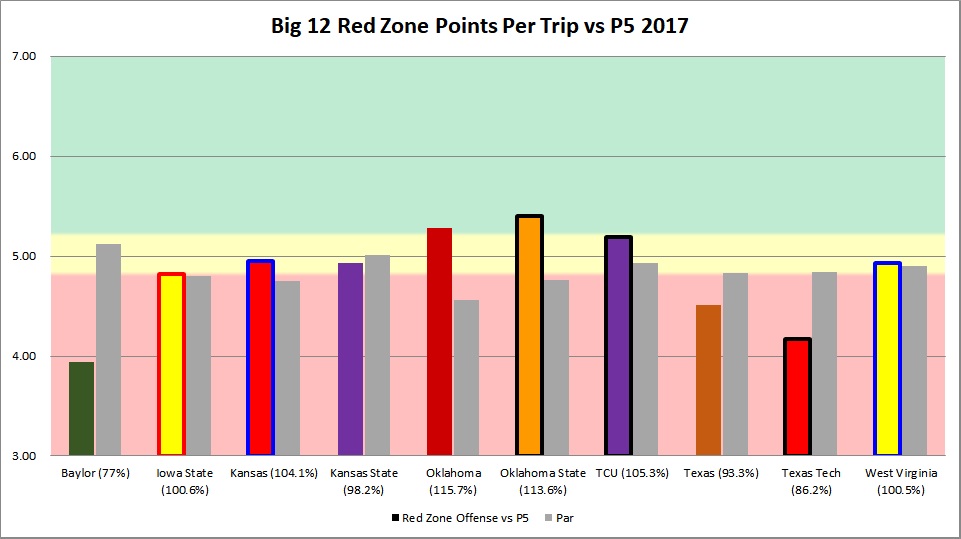
Yards tell part of the story, but you must convert them to points. Here's how many points each team scored per red zone attempt. Any offensive touchdown is worth 7 points (it would round to that even if I tracked PAT and 2 point attempts) and any made field goal is 3. The yellow band in this chart represents what the middle 33 percent of the country's offenses averaged in points per red zone attempt. "Par" for red zone points is a weighted average of how many points per trip a given opponent gave up to other P5 offenses weighted by the number of attempts the offense in question faced them.
Baylor, Texas, and Texas Tech struggled dramatically in the red zone. OU, OSU, TCU, and surprisingly Kansas did well. Everyone else was roughly as expected.
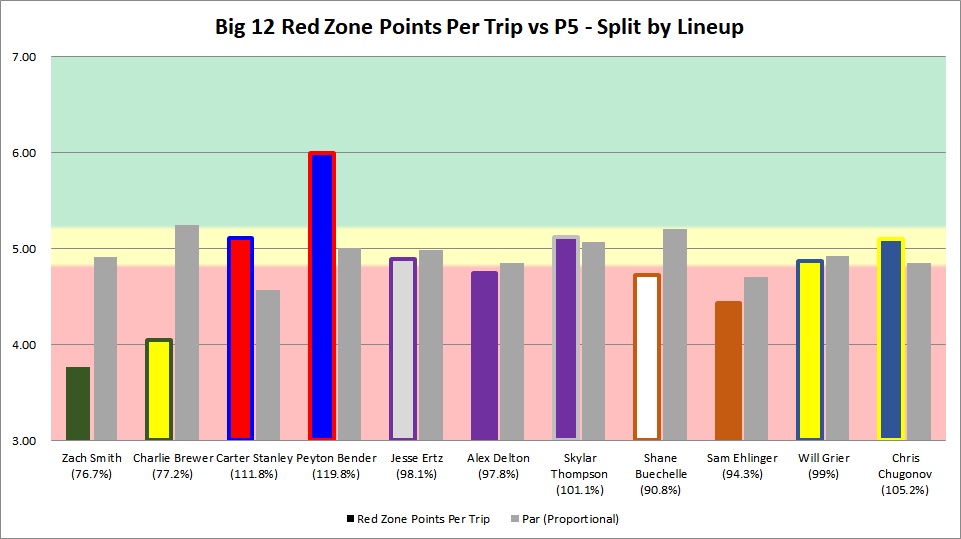
There really wasn't a lot of variation by lineup outside of Peyton Bender running up a big total against Tech and WVU's red zone defenses that made up 7/8 of his red zone attempts. UT's Shane Buechelle did better on raw stats but Sam Ehlinger did better vs par. None of the KSU quarterbacks differed more than 2.2% vs par.
Explosive Plays
Oklahoma and OSU make a huge impression here as the leaders in this statistic. WVU generated a lot of 30+ plays but were far more mortal with 40+ and 50+ but obviously losing Grier limits this stat a little. Texas, TCU, and ISU didn't do very well. With David Montgomery creating big plays on his own I was surprised how ISU fared here, I expected higher. Kansas and Baylor did better than I expected. Texas Tech was behind the Okie twins and WVU but was certainly dangerous.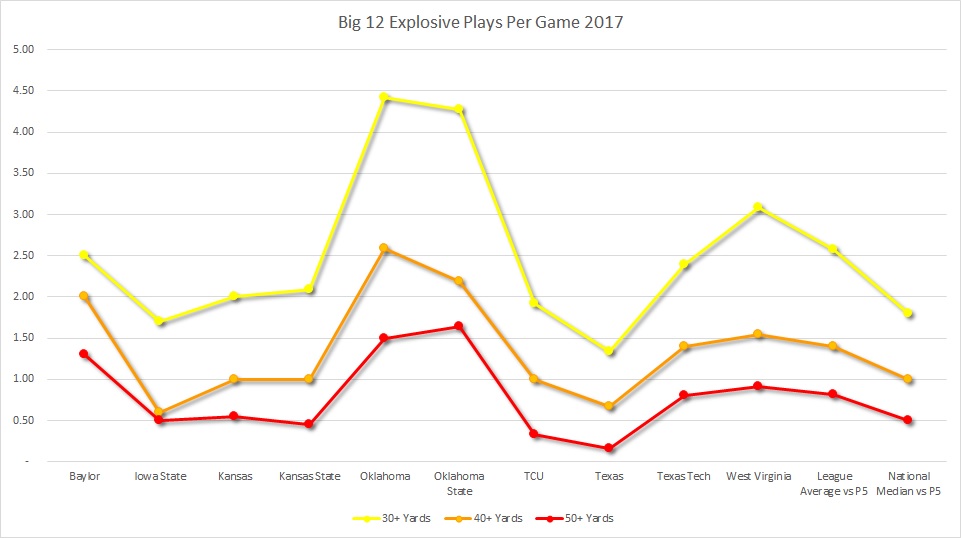
Points Per Drive
Offensive points per drive is one metric I have sometimes avoided unless I could filter out "gimme points" on short drives and non-offensive points as I see those two sources as less than indicative of an offense or defense and more indicative of a team statistic. With that said I do think a look here can illustrate how things tie together and I was able to omit direct non-offensive scores leaving only short fields to skew things.
Once again the two Okie schools show up big here. TCU leverages modest YPD and solid red zone play to come in third with Tech in fourth. West Virginia with Will Grier is fifth. It's a dead heat for 6th with ISU and KSU.
KU is clearly the worst with Baylor and Texas mirroring each other as OL issues and young QB's moving away from Briles schemes struggled to convert in the red zone.
What does it mean for 2018?
- Baylor is a squad that didn't struggle to move the ball or create big plays — they just couldn't cash in. When that line improves there is plenty of reason for optimism. Until it does you are in the position of trying to steal a few upsets in league play.
- ISU isn't the most explosive but moves it well, is effective in the red zone, avoids turnovers, and does a good job scheming their opponents. Their offense has outperformed par each of Campbell's two seasons and there is no reason to doubt he'll do it again even without Lazard.
- Kansas is producing at a level that is as bad as the Kevin Steele teams Baylor used to be saddled with. They were reasonably explosive and reasonably efficient in the red zone but everything else is questionable. They have some weapons but blocking for them and passing it to them is a big issue that has to get fixed.
- KSU with Delton at QB is a very dangerous offense. Thompson pulled off a couple big upsets but wasn't very productive on the stat sheet. Both have some development ahead of them to get where Snyder wants but right now the numbers overwhelmingly point to Delton being more productive last year. Snyder will go with who performs better now but I have to imagine Delton had an early lead.
- 2017 OU had one of the most productive offenses I have done drive stats for. Ahead of the 2011-2015 Briles offenses, 2005 Texas , and on par with 2005 USC. They averaged over 62% more yards per drive than opponents typically gave up. This practically doubled the impact vs par of the famed 2008 Sooner offense or the extremely productive 2016 offense. Kyler Murray will have serious talent and a very good scheme around him. Will he be able to produce enough to cover for that defense if it doesn't significantly improve? The answer to that question will determine a lot.
- The Pokes were extremely good but a lot of turnover at the QB and outside receiver spots will be tough to replace. Gundy is a great coach but it's really a question of how good the personnel at QB is. For all the success Mike had, their 2014 offense was terrible after Walsh went down until Rudolph burned his redshirt so it isn't unheard of. Hill, McCleskey, Stoner, and King will likely keep the big plays coming.
- TCU likely won't match par in yards per drive and will be solid in the red zone if the past two years are any indication. The big question is Shawn Robinson. He had one game where he was held to 27 per drive (12.5 below par) against Texas Tech and barely completed 1/3 of his passes. TCU needs him to perform at a higher level than that or else this could be 2016 again- a great defense carries a team to slightly above or below .500 because the offense struggled so much. Kenny Hill wasn't Boykin or Dalton but he didn't hold them back last year. TCU has a good chance to make some noise if they can get solid play from him.
- Texas much like Baylor needs to have their OL grow up but has the advantage of a reliable defense. They aren't very explosive but their defense and kicking game give them a boost. This squad struggled in all three categories I listed and it all starts up front.
- Tech graduates four dynamic receivers but could be better on offense if the line improves to allow them to convert more red zone points. The other two metrics were more than capable and the hope in Lubbock is that the defense takes another leap forward to help out more.
- West Virginia wasn't the equal of the OU/OSU offenses but was certainly more than a handful last fall and should be again. They really need Will Grier to stay healthy as there's no assurances that the train keeps rolling without him. With him in there they are a very dangerous team even if the defense doesn't dramatically improve.
This is the end of our brief look back at 2017. The Big 12 season is one week away!
Never miss the latest news from SicEm365!
Join our free email list

