Stats Preview: BYU's Role Reversal - Crushing Defense & Still Maturing Offense
This is part two of my Baylor vs. BYU preview, covering their statistical performance. Part one covered their roster, while part three will cover their X’s and O’s.
Below, we have a combination of charts and tables to help us understand the resume. The tables have BYU against their FBS opponents compared to other FBS teams against those same opponents. For comparison, I have included 2023’s raw stats as well. The charts will have a given metric with BYU in blue and either the opponent in the opponent’s colors or other FBS teams against their schedule in gray. The backgrounds will be shaded green, yellow or red, respectively, to indicate whether a metric is performing well, average or poor.
Offense
The Cougars have had a bit of a dropoff offensively since Baylor faced them in 2021 and 2022 with Jaren Hall at quarterback. Since then, the Cougars have lost several players to the NFL, including Hall, offensive tackle Blake Freeland, offensive tackle Kingsley Suamataia, standout wideout Puka Nacua and others who simply graduated but were great college players. They’ve attempted to backfill, but the result hasn’t been what Baylor fans remember.
Below, you see BYU’s yardage per drive going back to 2023 compared to what their opponents gave up to other teams. Games with former USC/Pitt QB Kedon Slovis are in navy, the 2022 comparison to Jaren Hall is in white, and the current BYU starter Jake Retzlaff’s games are in royal blue.
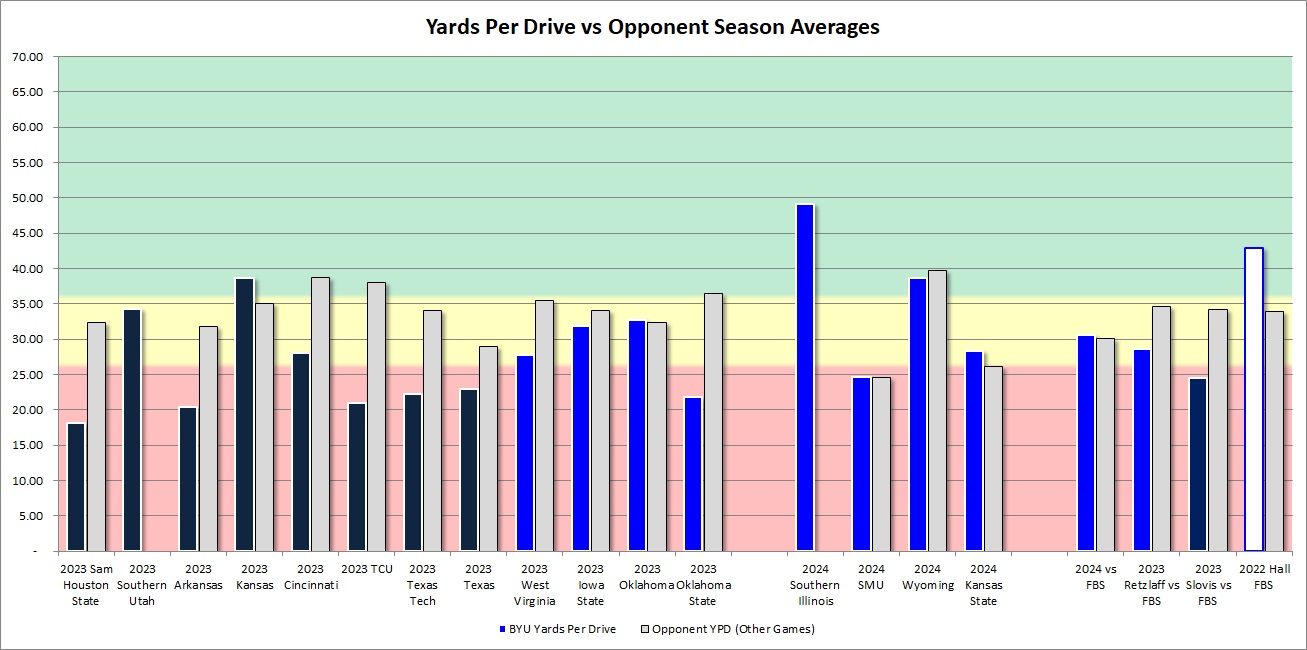
As we can see, they had a couple of big outings yardage-wise in 2023, but more often than not, it was a struggle. This year, they had a good outing against a couple of bad defenses and were slowed down a bit offensively against SMU and KSU. So far, the overall average isn’t that different than the offense with Retzlaff in 2023 and rarely has the offense come close to the yardage machine. It was the last time Baylor encountered the Cougars.
Offensive Overview Stats
The offense looks rougher in comparison to their opponents without FCS games like Idaho, HCU, and UT-Martin padding the opposing defensive stats. BYU is below expectation on yards per drive, yards per play, scoring drive percentage and third-down situations. They do overperform in red zone points.
| BYU vs FBS | Other FBS vs Opponents | 2023 | |
| Yd Drive | 30.58 | 38.23 | 25.95 |
| Points Per Red Zone Trip | 5.67 | 5.12 | 4.67 |
| Turnovers Per Game | 1.33 | 1.33 | 1.64 |
| Yards Per Play | 5.78 | 6.22 | 4.74 |
| Total Yards | 345 | 437.67 | 302.09 |
| % Of Drives Scored | 36.36% | 44.78% | 27.82% |
| % Turnover Drives | 12.12% | 11.94% | 13.53% |
| 3rd Down % | 21.21% | 42.7% | 28.38% |
| 3rd or 4th Down % | 39.39% | 53.93% | 35.81% |
The third-down stat in isolation is misleading, given how often they attempt fourth down and play for fourth down on third. BYU is tied for seventh in the number of attempted fourth-down conversions nationally. Below, we see a stacked bar chart of BYU’s offensive third-down conversions by game on either third or fourth down. The percent converted on third down is in darker color, while the fourth-down contribution is in white.
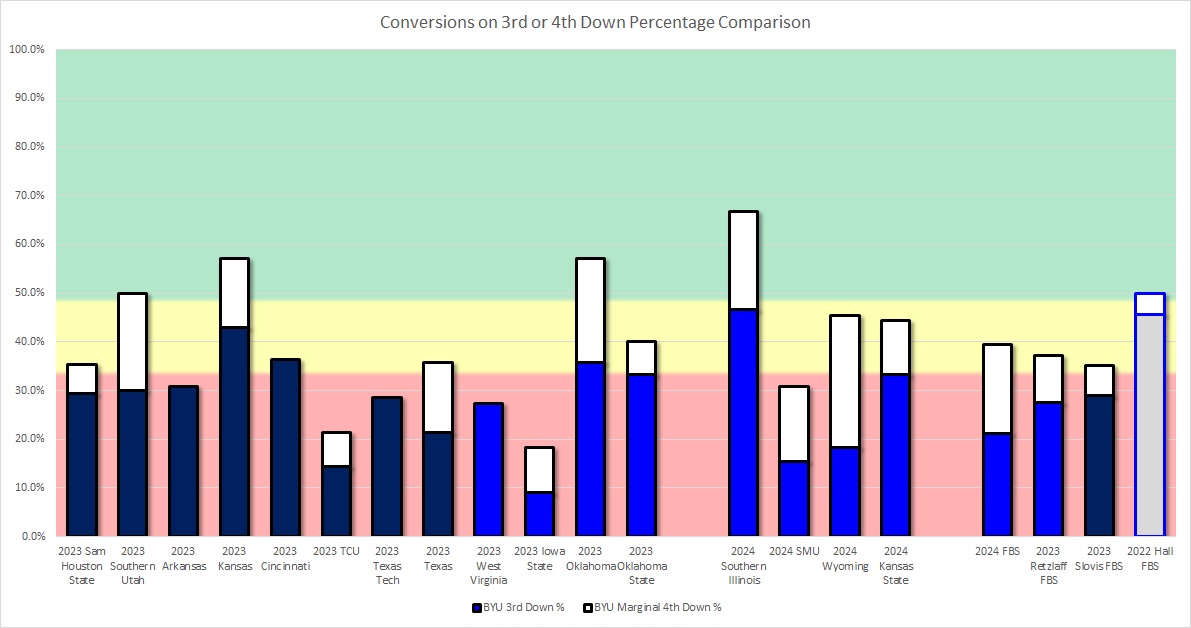
What I observe is that BYU has been awful on third down and needed fourth down a lot going back to last year. This is nowhere near the efficient machine they were at staying on the field in 2022. They had good games staying on the field against KU and OU last year, along with the FCS opponent this year, but so far, it’s been a lot of fourth-down risk to end up in merely a decent result. Regardless, the Bears need to call their defense as if virtually the whole field is four down territory.
Offensive Passing Game
The Cougars complete a decent 62% of their passes and have pretty normal yards per attempt and completion. This is a massive step up from the 54% they had a year ago against FBS opponents.
| BYU vs FBS | Other FBS vs Opponents | 2023 | |
| Completion Percentage | 61.8% | 64.29% | 54.4% |
| Yards/Att | 7.52 | 8.34 | 5.82 |
| Yards/Completion | 12.16 | 12.97 | 10.69 |
| Yards/Pass Including Sacks | 7.01 | 7.62 | 5.16 |
| Sack % | 3.26% | 4.55% | 4.96% |
| INT % | 3.26% | 1.82% | 2.09% |
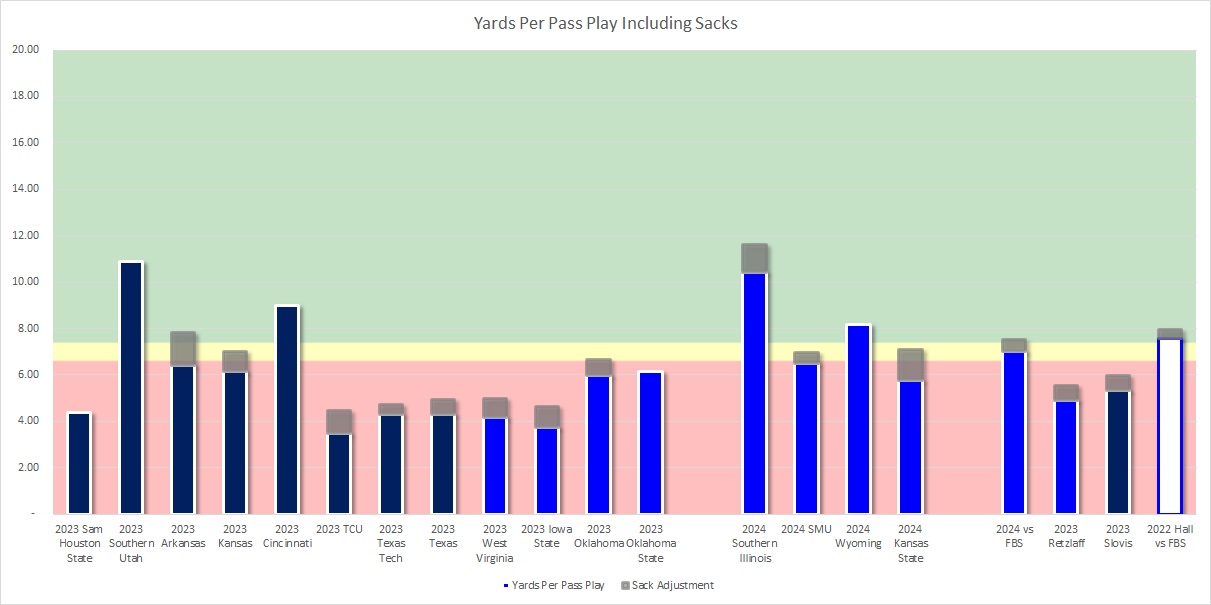
When we look at their sack-adjusted yards per attempt it’s pretty striking. The only games over the past two years where they resemble the strong 2022 passing game were the two FCS games, Cincinnati, and a terrible Wyoming team.
Offensive Run Game
On the ground the Cougars are not giving teams more than they usually allow other FBS teams this year. It’s honestly pretty similar from the non-QB positions to last year but the QB position is more productive.
| BYU vs FBS | Other FBS vs Opponents | 2023 | |
| Yards/Rush | 4.07 | 4.13 | 3.58 |
| Yards/Non-Sack Carry | 4.48 | 4.7 | 4.23 |
| QB Non-Sack YPC | 6.1 | 5.97 | 3.47 |
| Non-QB YPC | 4.42 | 4.5 | 4.57 |
| Run Play % | 48.6% | 47.87% | 45.36% |
Below we have an outlier chart where the combined stacked bars vertically equal the offense’s non-sack yardage per carry from the RB or QB positions. The stacked white bars are what a small amount of “outlier runs” of around 16-20 yards or more contribute to its tailback yards per carry average. The colored bars are what the remaining majority of their carries equate to. The background gives a barometer of what is good for an offense, with red (bad), yellow (average) or green (good) colors giving context.
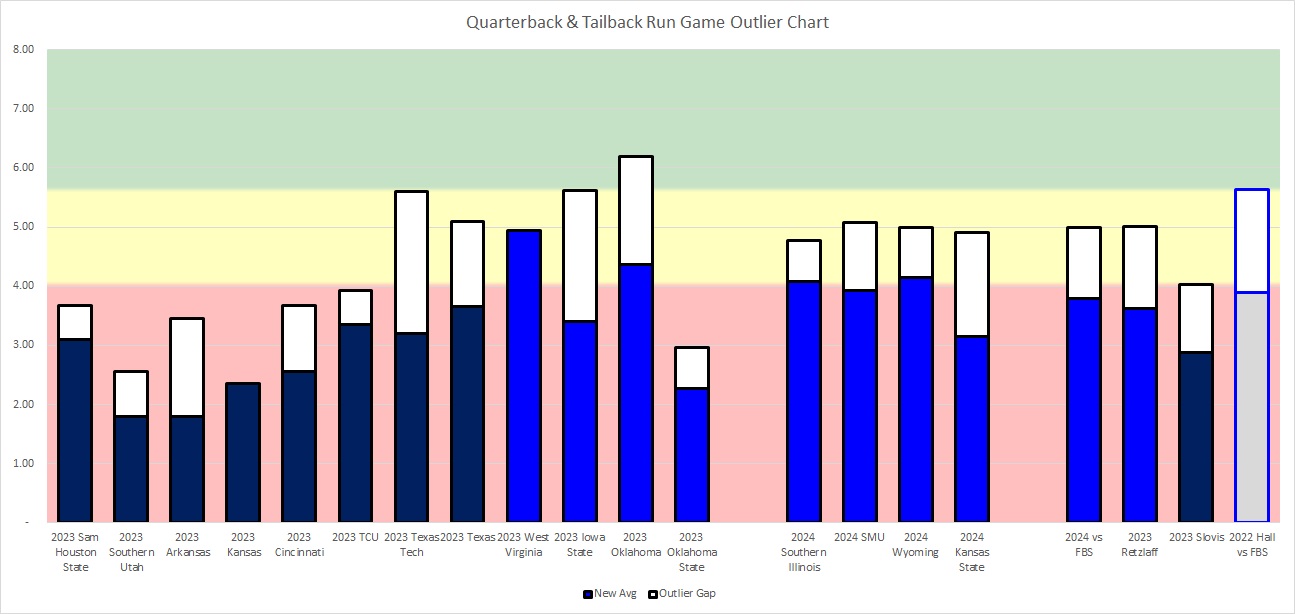
What we see is that the run game improved with Retzlaff, but it’s a far cry from the engine that kept the offense moving and on the field two years ago, although it did well on the ground against SMU and Wyoming.
Defense
Defensively is a different role-reversal. When last we saw the Cougars they were a struggling defense overall that had serious issues stopping people unless teams like Baylor got in their own way. Not anymore. This is one of the better defenses Baylor will face.

The difference from a year ago is massive. Going from allowing more yards than opponents typically generate to allowing way less.
Defensive Overview Stats
They have been lights out in each metric here. Really the only one where they are as expected for their schedule is third and fourth down percentages.
| BYU vs FBS | Other FBS vs Opponents | 2023 | |
| Yards Per Drive | 23.38 | 32.28 | 35.64 |
| Points Per Red Zone Trip | 2.9 | 5.56 | 4.73 |
| Turnovers Per Game | 2.33 | 0.83 | 1.64 |
| Yards Per Play | 4.06 | 5.34 | 5.93 |
| Total Yards | 281.67 | 322 | 424.18 |
| % of Drives Scored | 28.57% | 39.68% | 39.53% |
| % Turnover Drives | 20% | 7.94% | 13.95% |
| 3rd Down % | 36% | 37.84% | 44.59% |
| 3rd or 4th Down % | 42% | 44.59% | 49.68% |
Below we see a stacked bar chart of BYU’s defensive third down conversions by game on either third or fourth down. The percent converted on third down is in darker color while the fourth down contribution is in white.
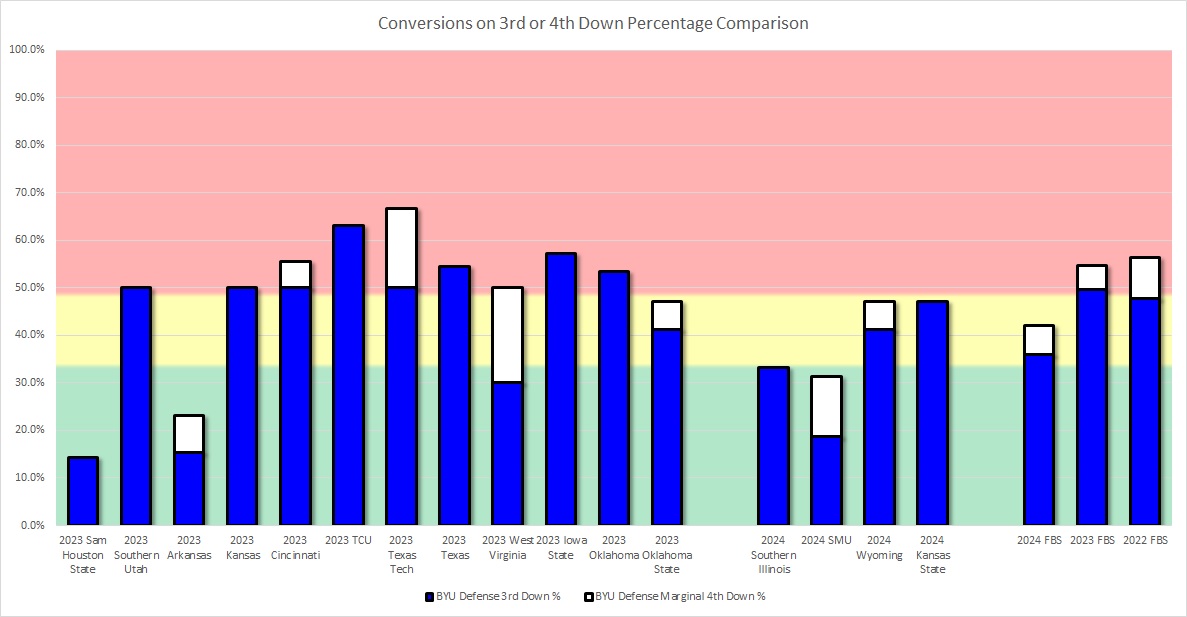
What we see is that other than K-State where the Wildcats are usually strong here and Wyoming where backups likely padded the number they’ve forced teams to use fourth down to convert. Baylor will probably need to do so as well.
Defensive Passing Game
This team is crushing opposing passing games but the level of opposing QB is pretty limited so far with SMU unable to protect their only pocket guy and KSU starting a young one. With that said the Cougars have been locking their opponents down.
| BYU vs FBS | Other FBS vs Opponents | 2023 | |
| Completion % | 48.96% | 60.14% | 62.13% |
| Yards/Att | 4.41 | 6.99 | 6.98 |
| Yards/Completion | 9 | 11.63 | 11.24 |
| Yards Pass Play Including Sacks | 3.73 | 6.38 | 6.51 |
| Sack % | 4.95% | 4.52% | 2.85% |
| INT % | 3.96% | 1.94% | 3.37% |
The difference in sack-adjusted yards per attempt is striking. Last year was much worse and this year has been very strong. Now SMU playing their run-first QB since they weren’t able to protect the other guy and KSU playing a young mobile QB aren’t exactly facing the top QB’s on the schedule for BYU but it’s massive improvement so far.
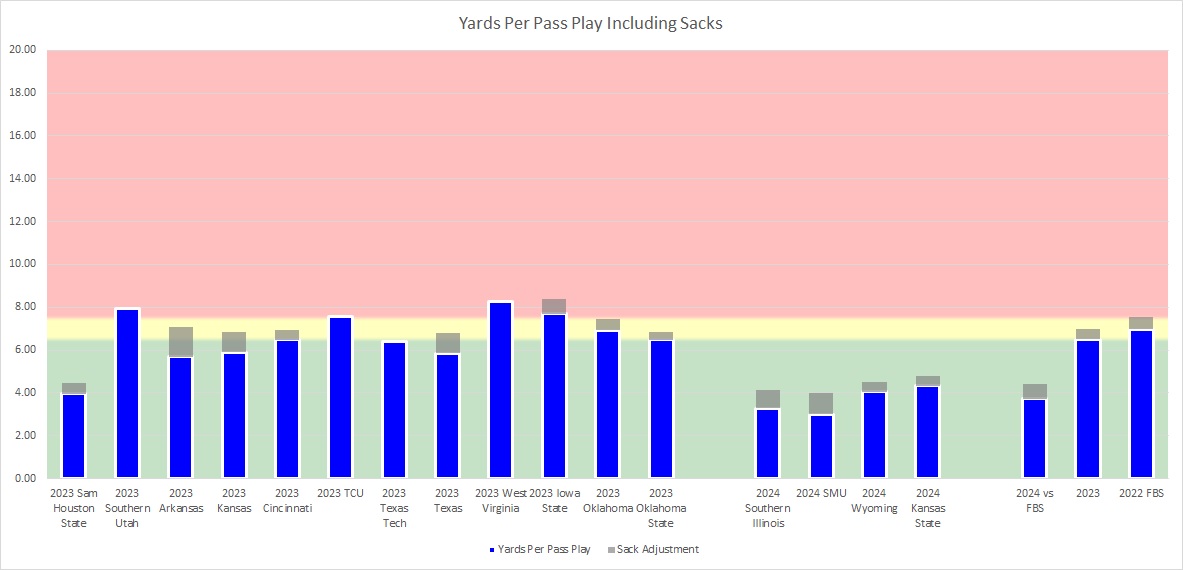
BYU is tied for 10th nationally in opponent long passing plays allowed, with only five this year. Here’s what that looks like as a percentage of attempts or sacks. They’ve been outstanding here.

Defensive Run Game
The run defense has been a place where their defensive maturation has shined. They give some yards to QBs but they hold opposing run games in check pretty decently.
| BYU vs FBS | Other FBS vs Opponents | 2023 | |
| Yards/Rush | 3.77 | 4.19 | 4.97 |
| QB Non-Sack YPC | 5.58 | 5.24 | 5.74 |
| Non-QB YPC | 4.01 | 4.8 | 5.43 |
| Run Play % | 51.44% | 57.18% | 50.95% |
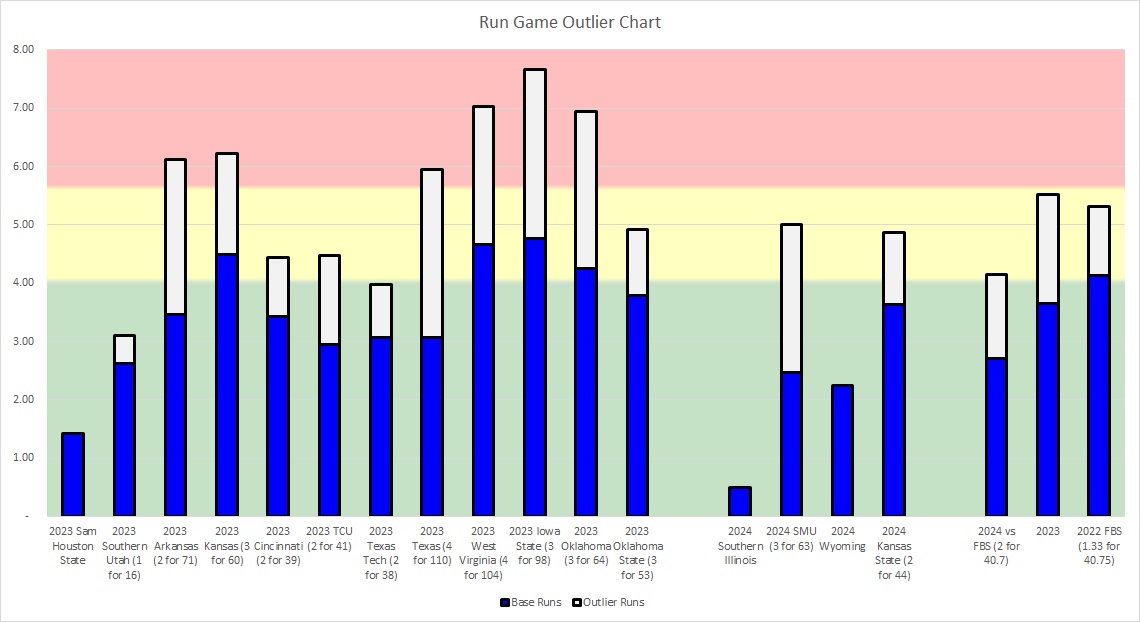
When we look at the outlier chart it’s a big shift from the last two years. KSU ripped off two runs and SMU hit three to get the overall yards per carry for tailbacks in decent shape but we can see it was not consistent.
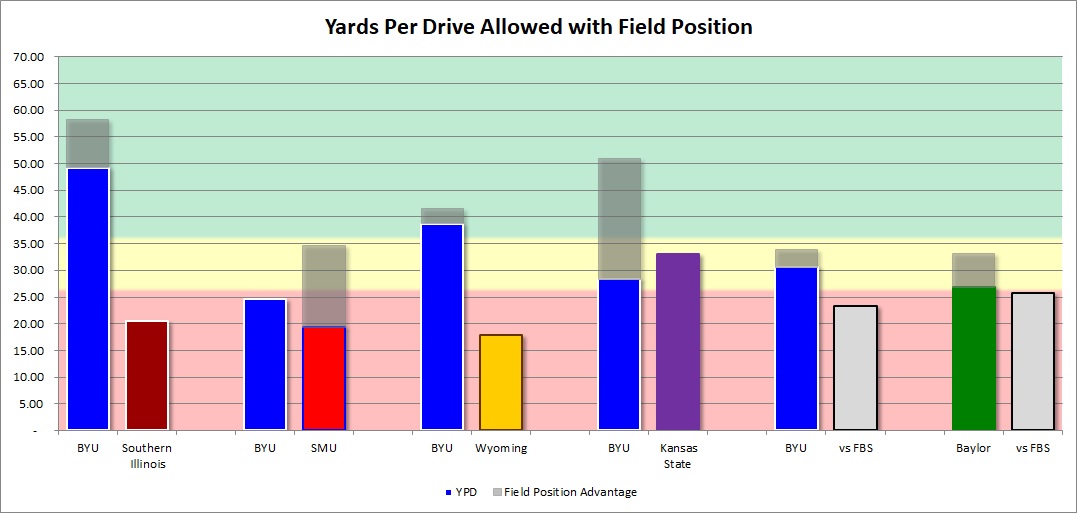
Special Teams & Field Position
The Cougars are a very good special teams return unit already having a 90-yard touchdown on a punt return and a 100-yard kickoff return touchdown. Their punt returns haven’t been overly productive outside of that one, though, although the kickoff returns have been solid outside of the touchdown return. They cover kicks and punts well, and this helps them enjoy about 3.4 yards of better field position than their opponents. Over the course of the game, this is basically about 40 yards when you multiply that by expected drive counts.
| BYU vs FBS | Other FBS vs Opponents | 2023 | |
| Kick Return Average | 31.17 | 20.72 | 19.44 |
| Punt Return Average | 24.25 | 9.55 | 4.18 |
| Opponent Kick Return Avg. | 19.2 | 24.21 | 19.24 |
| Opponent Punt Return Average | 5.8 | 48.67 | 16.52 |
| Average Field Position | 67.98 | 69.97 | 70.69 |
| Opponent Average Field Position | 71.38 | 72.86 | 69.96 |
| Touchback Kickoff % | 66.67% | 56.41% | 56.25% |
| Opponent Touchback Kickoff % | 53.85% | 36.11% | 43.75% |
They do a decent job getting touchbacks 2/3 of the time, taking opposing returners out of it. Their placekicker is a preseason All-Big 12 and hit a 50-yarder against SIU. He has one miss from 50+ and one miss between 30-39 yards as he’s hit six of eight this fall.
Field position has been their advantage in every game except the SMU game. It was most noticeable against Kansas State, where turnovers made a MASSIVE 23-yard advantage in the starting position. Since the two teams averaged nine drives, which equates to nearly 204 yards of field position advantage, it’s somewhat of a field position showdown – Baylor excels here as well.
Final Takeaways
- This team will be one of the best Baylor has faced alongside Utah.
- Their offense isn’t amazing but protects the ball and can convert in the red zone when it’s special teams or defense provides a short field. With that said Baylor has done well defensively this fall so this could be one where the Bear defense gives the offense time to find itself.
- This defense is MUCH better than any BYU defense I have seen in recent years. They will be a challenge for Baylor’s developing offense.
- The special teams will be a critical if this game turns into a rock fight. Both teams excel in that area and it could be a deciding factor.
Next we will take a look at HOW the Cougars attack and how Baylor can defend them.
Follow @Baylor_S11 on X!