This is the second part of my bye-week look at Baylor. Part one covered the roster with the advanced depth chart. This will look at the Bears and how they perform statistically.
After A New OC and A Head Coach As DC, How Are The Changes Trending?
After a dismal 2023, the Bears added a new offensive coordinator in Jake Spavital, and head coach Dave Aranda took over defensive playcalling. How well has the change played out in specific stats that might not show with the record? Let’s take a look.
Below is a combination of charts and tables to help us understand the resume so far. The tables have BU against their opponents compared to other teams against those same opponents. For comparison, I have included 2023’s raw stats as well. The charts will have a given metric with BU in green and either the opponent in the opponent’s colors or other FBS teams against their schedule in gray. The backgrounds will be shaded green, yellow or red, respectively, to indicate whether a metric is performing well, average or poor.
Offense
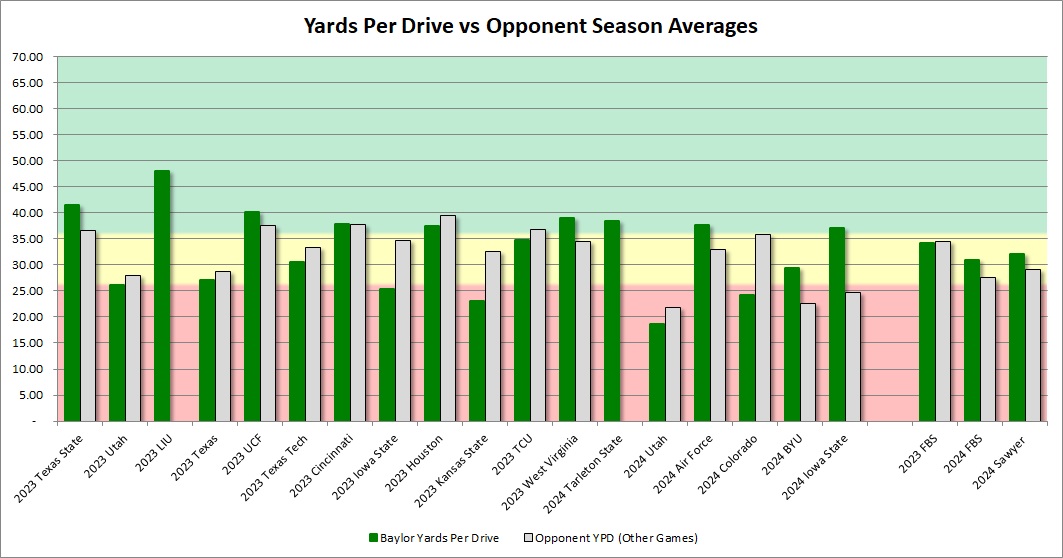
The Baylor offense has been up and down yardage-wise this year but, on average, has outgained the other FBS teams that played their schedule in yards per drive after being underneath a much less difficult schedule of defenses last fall. The Bears had anemic production against Utah and did less than expected against CU but overperformed against Air Force, BYU and ISU relative to schedule.
Offensive Overview Stats
This offense has outperformed other opponents against some very solid defenses in yardage despite the raw yardage per drive being lower than last year. They have increased their red zone efficiency against a solid red zone schedule, scoring on a higher percentage of drives and turning the ball over less frequently than the other FBS teams facing their schedule. However, the turnover drive percentage has generally been better than this due to the 25% from the Air Force game spiking the average.
| BU 2024 vs FBS | Other FBS vs Opponents | 2023 vs FBS | |
| Yd Drive | 29.38 | 27.83 | 32.99 |
| Points Per Red Zone Trip | 4.83 | 4.28 | 3.84 |
| Turnovers Per Game | 1.6 | 2 | 1.27 |
| Yards Per Play | 5.35 | 4.98 | 5.31 |
| Total Yards | 347.8 | 324.67 | 376.64 |
| % Of Drives Scored | 32.79% | 26.86% | 34.15% |
| % Turnover Drives | 13.11% | 17.14% | 11.38% |
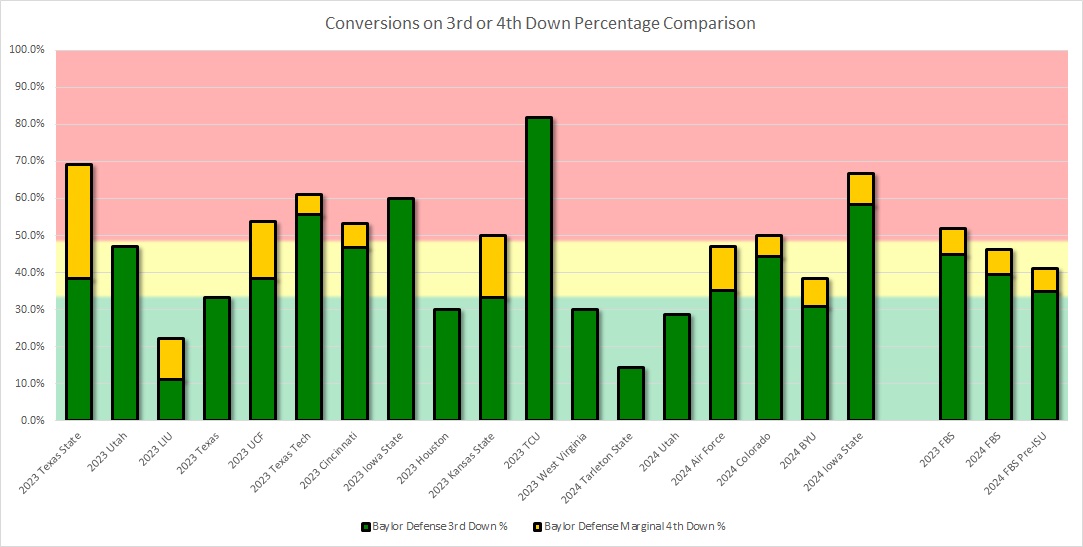
| 3rd Down % | 31.88% | 31.82% | 35.58% |
| 3rd or 4th Down % | 46.38% | 40.91% | 46.01% |
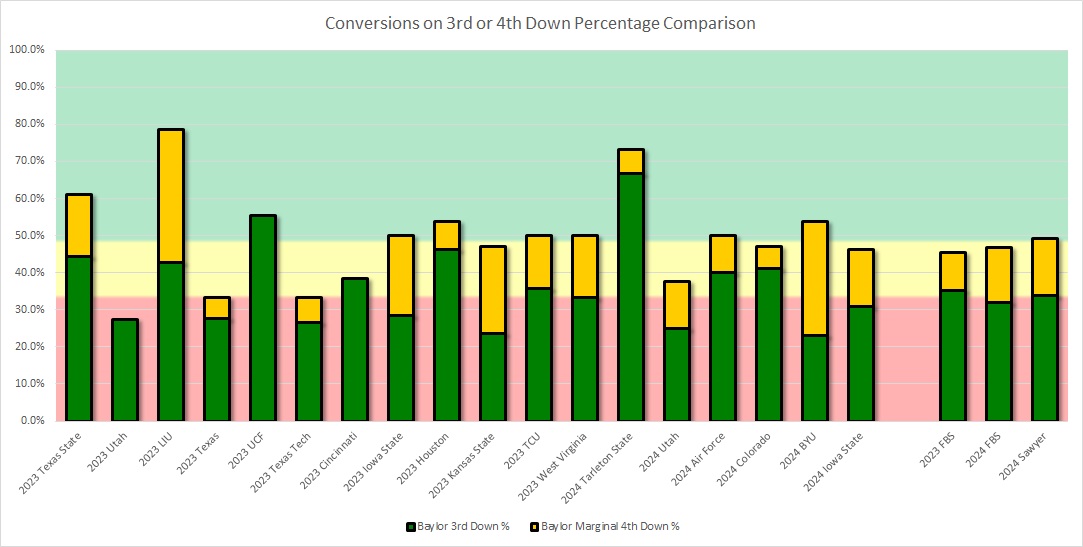
They haven’t been quite as solid on third downs but have tried to make up for it on fourth down, with the games featuring Sawyer Robertson (RJr.) at QB getting the combined third and fourth down conversions up to around 49%. Baylor has a lot of stressful situations due to less efficient third downs, but the Bears have attempted more fourth down tries than anyone nationally, so some element of calling a third down to set up a fourth down is taking place.
Offensive Passing Game
The offense is not completing as high of a percentage of passes as last fall but is outperforming all the metrics relative to others facing their schedule.
| BU 2024 vs FBS | Other FBS vs Opponents | 2023 vs FBS | |
| Completion Percentage | 56.96% | 53.79% | 60.24% |
| Yards/Att | 6.92 | 5.92 | 7.31 |
| Yards/Completion | 12.14 | 11.01 | 12.14 |
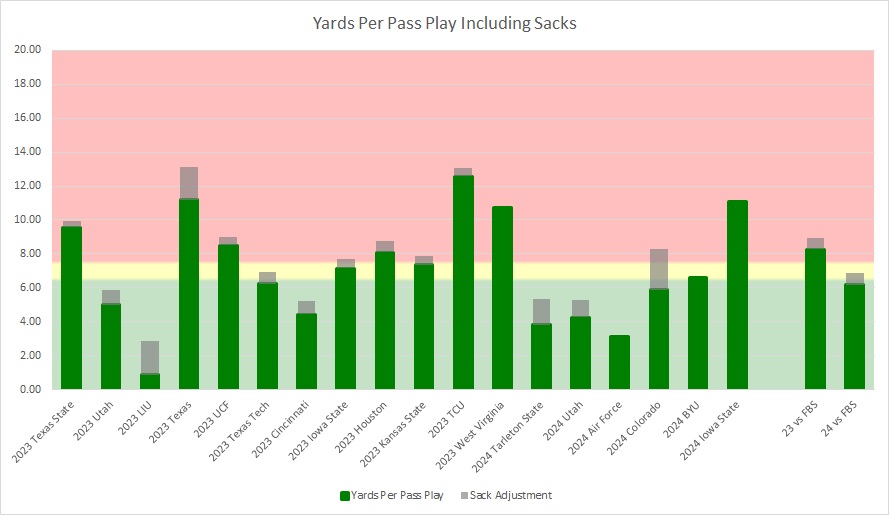
| Yards/Pass Including Sacks | 6.16 | 5.28 | 6.2 |
| Sack % | 4.82% | 5.08% | 7.57% |
| INT % | 1.81% | 4.24% | 1.56% |
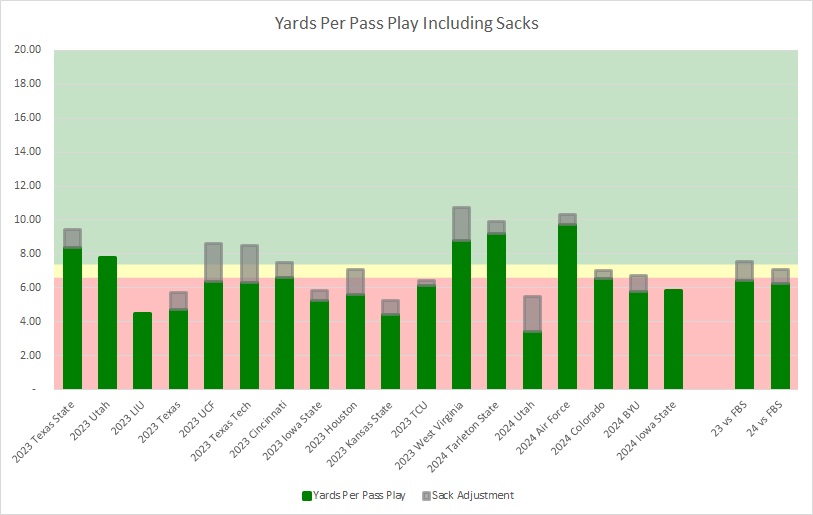
You see the struggles with the passing game here. Tarleton and Air Force had great sack-adjusted yards per attempt, but the efficiency against BYU, ISU, Utah and, to a lesser extent, Colorado hasn’t been there. It’s not been able to match the 2023 season where Blake Shapen led to a higher raw yards per attempt in games like UCF, Cincinnati and others while a finally healthy Robertson did well against WVU.
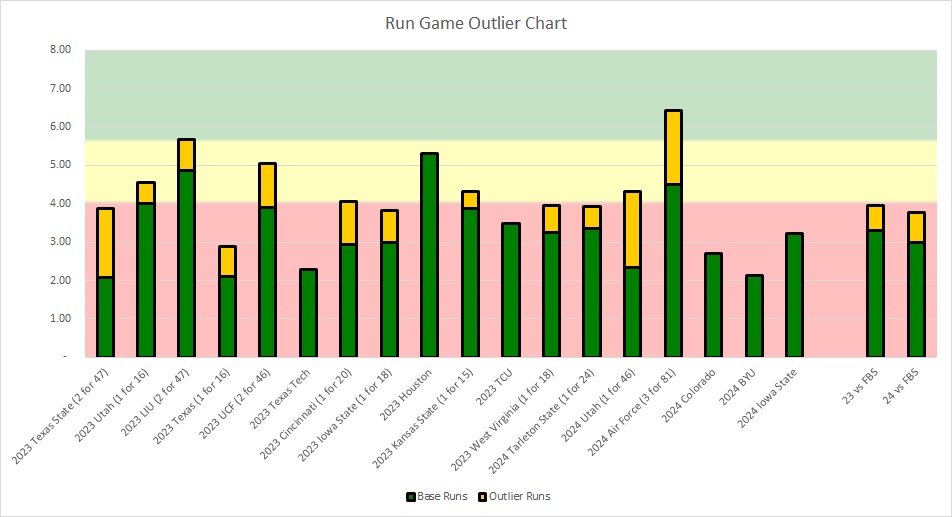
Offensive Run Game
The run game, however, is still struggling like last fall and is not matching other teams against their opponents. However, having two dual-threat quarterbacks has given the quarterback non-sack carries more efficiency.
| BU 2024 vs FBS | Other FBS vs Opponents | 2023 vs FBS | |
| Yards/Rush | 3.87 | 4.19 | 3.04 |
| Yards/Non-Sack Carry | 4.5 | 4.71 | 4.1 |
| QB Non-Sack YPC | 6.78 | 5.12 | 5.09 |
| Non-QB YPC | 3.93 | 4.99 | 4.04 |
| Run Play % | 48.92% | 51.69% | 42.44% |
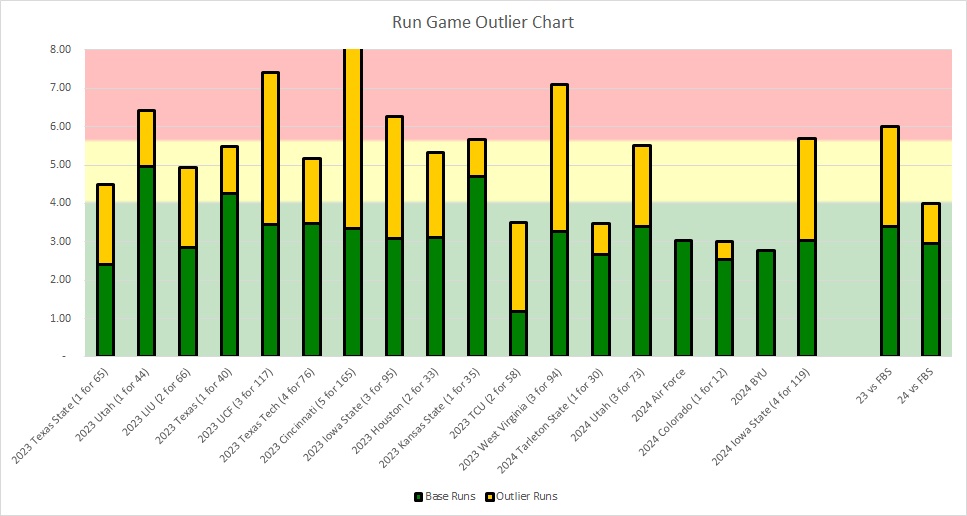
Below is a stacked chart where the combined bars are the tailback yardage per carry, and the lighter-colored bars at the top are the portion attributable to outlier runs of roughly 16+ yards. Aside from LUI 2023, UH 2023 and Air Force this year, the Baylor offense hasn’t been able to get the tailbacks going to any great degree. One long run against each of Utah and Tarleton spiked the average from a fairly low 2.98 to 3.76.
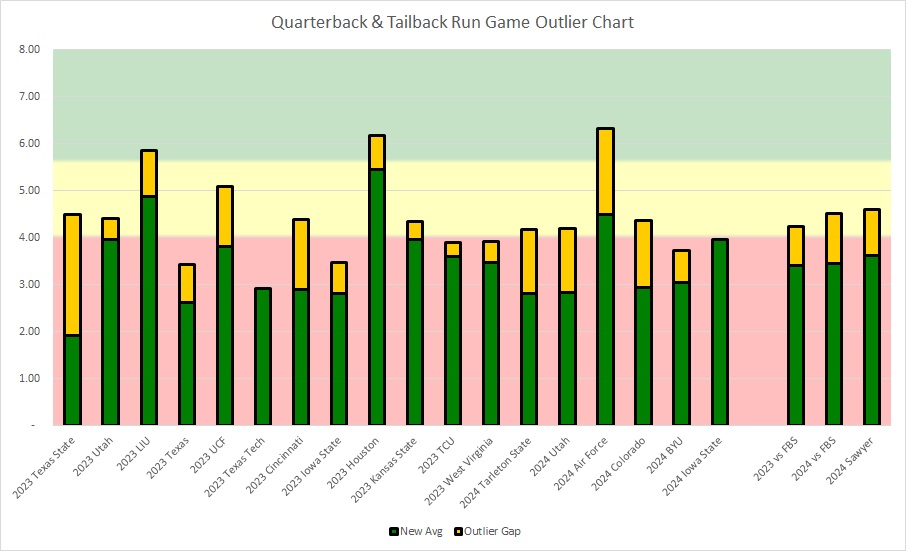
When we do the same chart, we see that Baylor gets a lot of boost from adding the quarterback as the plus-one in the run game, and the scrambles on pass plays add some help.
Given the difficult production both on the ground and on third downs, the expected yardage likely needs to be considered. Below, we see how each tailback’s carries are split. Baylor, as a group, struggles to match other Big 12 tailback corps, generating a lower percentage of three-plus yard runs and 16+ yard runs with a heavier percentage getting two or less.
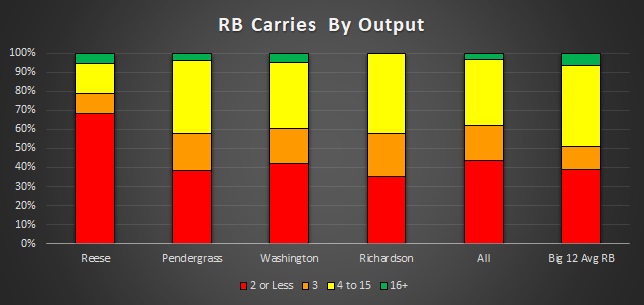
When we analyze each tailback, we can see why Richard Reese (Jr.) may be getting his number called less. If they need the run to get what they can inside, the other three, carrying 20-35 extra pounds, provide a lower likelihood of being stuffed for no additional yards on contact by simply falling forward for a yard. Reese is probably the best big play guy of the group, but if it’s a lot of getting stuffed, which in turn kills drives, it’s hard to turn there. With the others, you can get multiple three-to-four-yard carries to set up third or fourth down.
Defense
The Baylor defense has generally been a more complete unit than the offense this fall until this past game, when they allowed nearly 2.3 times the yards per drive they allowed other Power Four schools, which was pretty startling. Prior to that, Baylor had held every opponent below what other teams had allowed in yards per drive and done so fairly comfortably per drive.
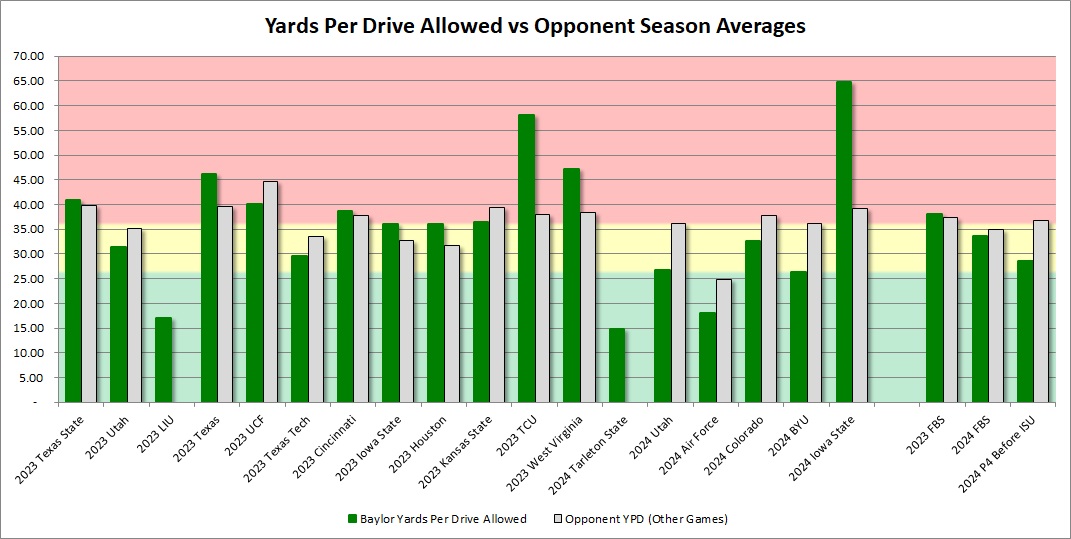
This is a big jump from 2023 when the only strong performances were against an injured Utah game and FCS LIU. Tech was nearly 35 yards per drive prior to mop-up time.
Defensive Overview Stats
The Bears have improved, but the following table, factoring in only FBS opponents for their schedule, is a harsher metric. Baylor hasn’t been able to limit yards per drive or the third and fourth down conversion rates well, but they have limited the yards per play relative to schedule. However, the defense is worlds better than 2023 overall.
| BU 2024 vs FBS | Other FBS vs Opponents | 2023 vs FBS | |
| Yards Per Drive | 33.71 | 31.31 | 40.1 |
| Points Per Red Zone Trip | 5 | 4.92 | 4.84 |
| Turnovers Per Game | 1.2 | 1.33 | 1.18 |
| Yards Per Play | 5.35 | 5.55 | 6.72 |
| Total Yards | 370.2 | 363.07 | 443 |
| % of Drives Scored | 39.66% | 34.27% | 49.58% |
| % Turnover Drives | 10.34% | 11.24% | 10.92% |
| 3rd Down % | 39.19% | 31.47% | 46.15% |
| 3rd or 4th Down % | 45.95% | 40.1% | 53.15% |
Prior to ISU, the Bears held up better on third and fourth downs, but the Cyclones hammered them. However, last year had some successes like WVU and UH in this metric but several absolute collapses. I view this as a major improvement.
Defensive Passing Game
The pass defense has majorly improved. It has a better completion percentage allowed, a better sack rate, an improved interception rate and a better relative to schedule. It hasn’t been great, but it’s been better.
| BU 2024 vs FBS | Other FBS vs Opponents | 2023 vs FBS | |
| Completion % | 56.15% | 61.21% | 65.92% |
| Yards/Att | 7.56 | 7.18 | 8.91 |
| Yards/Completion | 13.47 | 11.73 | 13.51 |
| Yards Pass Play Including Sacks | 6.54 | 6.41 | 8.24 |
| Sack % | 7.14% | 5.31% | 4.56% |
| INT % | 2.86% | 3.4% | 1.82% |
That said, ISU obliterated them, and without the sacks against a poor line, CU would have as well. AFA, Utah’s freshman quarterback, BYU and Tarleton aren’t exactly the top passing attacks.
With that said, it’s been an improvement from 2023, where two-thirds of the opponents lit them up.
Defensive Run Game
On the ground, the team has been generally solid. Shoring up the nose tackle spot and one inside linebacker spot has helped them limit the run with light box counts. Baylor is limiting the run well relative to schedule and doing so in a way that frees up bodies in pass defense.
| BU 2024 vs FBS | Other FBS vs Opponents | 2023 vs FBS | |
| Yards/Rush | 4.02 | 4.19 | 5.05 |
| QB Non-Sack YPC | 5.09 | 4.51 | 5.09 |
| Non-QB YPC | 4.5 | 4.97 | 5.96 |
| Run Play % | 59.54% | 52.04% | 54.62% |
The tailback outlier chart below tells the tale. Even against ISU, there were many limited runs, with a small handful that went big. It’s never good to allow any big runs, but limiting the rest at least allows for the chances to get off the field on third down.
Special Teams & Field Position
The Bears have been massively improved here. Both return games overperform their schedule, and the coverage units have been doing the same, showing massive improvement from 2023. Additionally, the new kickoff specialist has been forcing constant touchbacks and depleting return opportunities even further. However, the blocked field goal and blocked punt for touchdowns against Utah and ISU were brutal.
| BU 2024 vs FBS | Other FBS vs Opponents | 2023 vs FBS | |
| Kick Return Average | 25.5 | 20.53 | 24.64 |
| Punt Return Average | 22.29 | 7.8 | 16.33 |
| Opponent Kick Return Avg. | 10 | 26.23 | 18.89 |
| Opponent Punt Return Average | 6.25 | 10.26 | 13.15 |
| Average Field Position | 68.07 | 71.3 | 71.3 |
| Opponent Average Field Position | 69.8 | 70.89 | 67.75 |
| Touchback Kickoff % | 79.17% | 69.35% | 25.93% |
| Opponent Touchback Kickoff % | 57.14% | 50.63% | 41.67% |
Below, you see how much Baylor can potentially garner the field position advantage. They had significant edges against Tarleton, AFA, Colorado and Boulder, which absolutely helped them. BYU, Utah, and ISU winning the field position battle hurt Baylor’s chances.
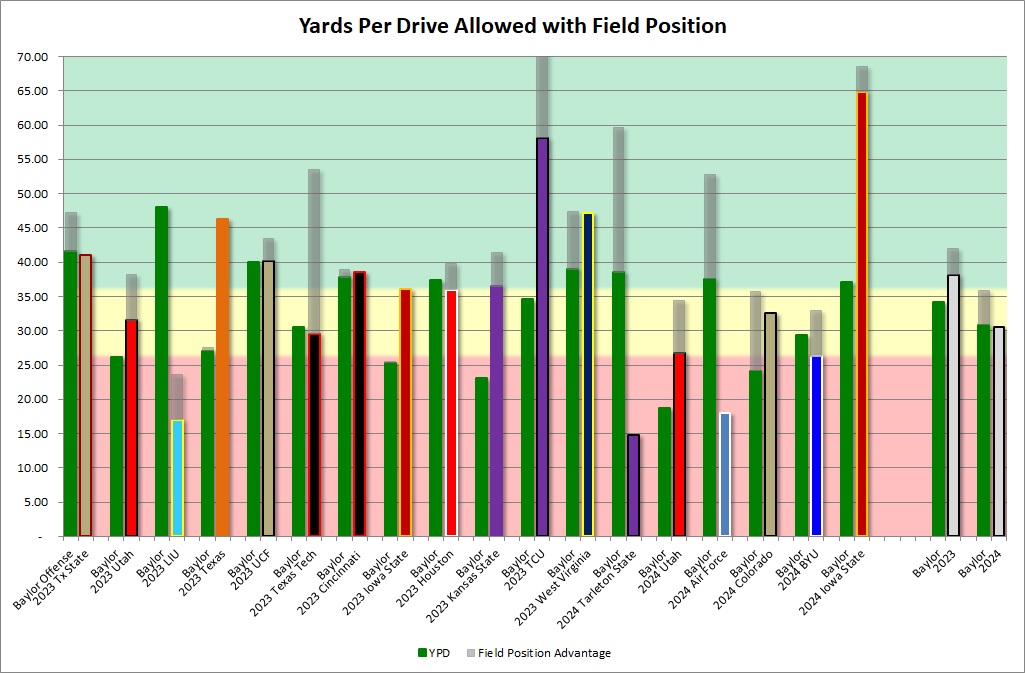
Baylor was much worse in the starting field position last year, with disadvantages against Tech, Utah, UH, TCU and KSU.
Key Takeaways
- The team is improved from 2023. Particularly in defense, special teams returns and kick coverage.
- The offense is less improved than the defense. The issues in the run game are difficult to get around.
- The defense is coming off their worst game by far and will have to prove their improvement over this next stretch.
- Improvement from 2023 is just a baseline expectation – not the goal.
Follow @Baylor_S11 on X!