This is Part 2 of my Baylor-Oklahoma State preview, covering the Cowboys’ recent statistical performance. Part 1 covered their roster, while Part 3 will cover their X’s and O’s.
Gundy’s Firing Comes After A Statistically Bad Run
Since I published Part 1, Oklahoma State has decided to fire arguably the best coach in their history, Mike Gundy, following a disappointing run over the last two years. How bad has it gotten, and what do the numbers tell us?
Below is a combination of charts and tables to help us understand the resume from recent years. The tables compare OSU's performance against its opponents. The charts will feature a given metric, with OSU represented in orange & black, and either the opponent in their colors or other Power Four teams on their schedule in gray. The backgrounds will be shaded green, yellow or red, respectively, to indicate whether a metric is performing well, average or poor.
Offense
OSU’s offense was decent but not particularly strong last fall. They had big outings against Tulsa, Kansas State, BYU, TCU and Texas Tech, but also had bad outings such as Utah and Colorado, which the second admittedly didn’t have QB Alan Bowman.
This fall (designated in black with orange outline), it has been half-decent against limited opponents in Tennessee-Martin (FCS) and Tulsa, while it did NOTHING against Oregon’s starters. It’s been rough.
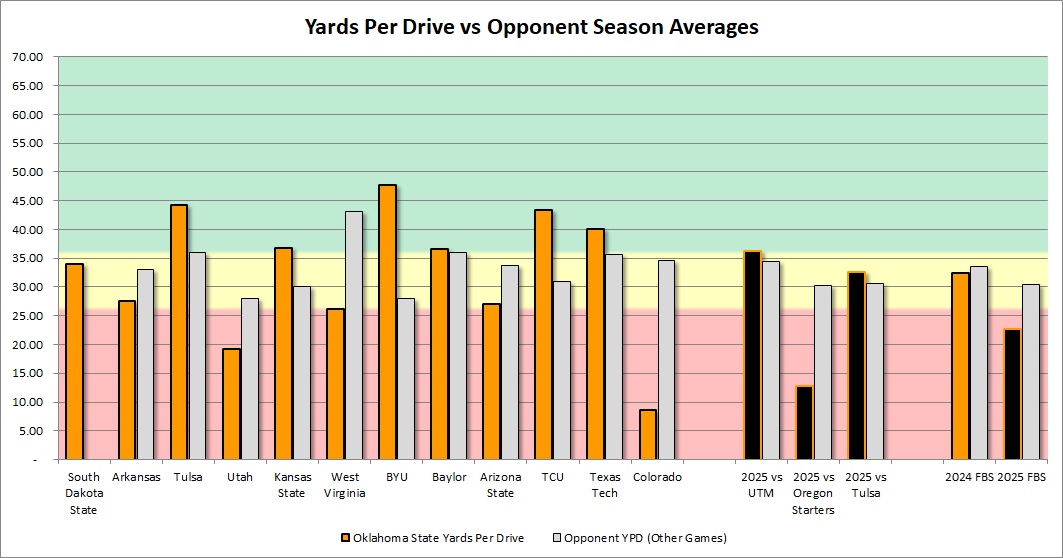
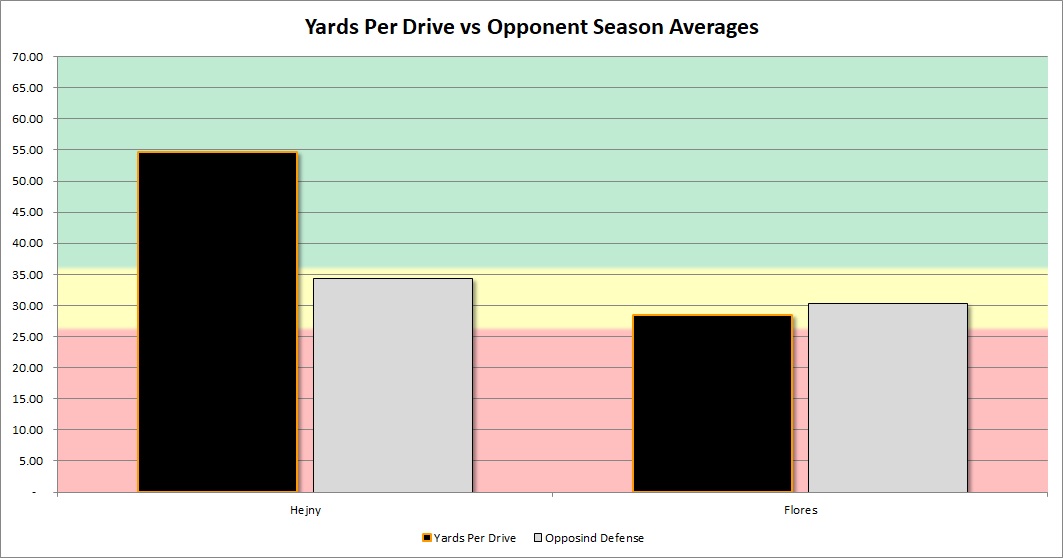
The opening game had promise on offense for about a quarter while speedster dual-threat QB Hauss Hejny was commanding the offense. However, once he went down hurt, Zane Flores struggled to move the offense and has largely done so outside of the second half of the Tulsa game.
Offensive Overview Stats
OSU is underperforming in every metric here aside from limiting turnovers. It struggles to move the ball, convert in the red zone, convert third-down scenarios and score.
| OSU 2025 | Other Teams vs Opponents | OSU 2024 vs FBS | Other Teams vs Opponents | |
| Yd Drive | 27.2 | 32.06 | 32.49 | 33.73 |
| Points Per Red Zone Trip | 4.92 | 5.61 | 5.33 | 4.98 |
| Turnovers Per Game | 0.67 | 1.08 | 2.09 | 1.44 |
| Yards Per Play | 4.68 | 5.88 | 5.57 | 5.65 |
| Total Yards | 324.33 | 264.5 | 372.18 | 378.46 |
| % Of Drives Scored | 25% | 35.35% | 33.59% | 37.99% |
| % Turnover Drives | 5.56% | 13.13% | 17.56% | 12.68% |
| 3rd Down % | 36.73% | 41.44% | 35.37% | 40.06% |
| 3rd or 4th Down % | 42.86% | 54.95% | 45.58% | 47.78% |
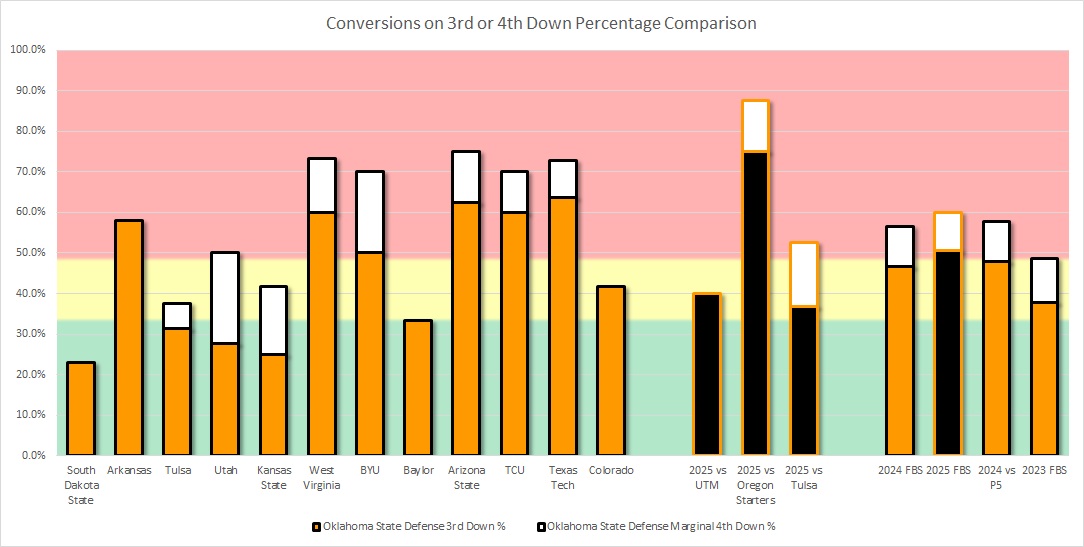
Here’s a closer look at how they handle third and fourth downs. The bottom of the stacked bars is the percentage of their third downs that they converted. The top is the fourth downs they converted out of their total third down chances. It answers the question: If they get to third down, how efficiently do they convert on the following two downs?

As far as staying on the field, the overall stat is generous. They did well against UT-Martin from the FCS, but have struggled over the last two weeks, particularly when teams get them to third down. They struggled most weeks last fall and had to rely on fourth down a good bit. This year is struggling even with fourth down as an option.
Offensive Passing Game
This is where the offense really took a step back. The passing attack is doing worse in every metric except interception rate and sack rate. Compared to the opponent’s other games, this offense doesn’t complete passes as well, generate yards when they do, and the net effect is that even with a slight decrease in sack frequency, the yards per sack-adjusted attempt is way down. They regressed in each stat except interception rate since 2024.
| OSU 2025 | Other Teams vs Opponents | OSU 2024 vs FBS | Other Teams vs Opponents | |
| Completion Percentage | 56.04% | 60.53% | 58.41% | 60.08% |
| Yards/Att | 5.68 | 7.37 | 6.98 | 7.43 |
| Yards/Completion | 10.14 | 12.18 | 11.94 | 12.36 |
| Yards/Pass Including Sacks | 4.97 | 6.37 | 6.48 | 6.55 |
| Sack % | 6.19% | 7.32% | 3.03% | 6.02% |
| INT % | 2.06% | 2.85% | 3.96% | 2.73% |
Their yards per sack-adjusted attempt are below in the colored bars. The raw yardage per attempt lost to sack yardage when those plays are included is in the shaded stacked column. It shows just how dramatic the air attack fell.

Visually represented above, we can see that OSU had an air attack that caused issues for Tulsa, Tech, Baylor, KSU, Arkansas and WVU last fall. This time? Nobody other than UT-Martin has had an issue limiting them. It’s been a huge dropoff.
Offensive Run Game
This run game isn’t as capable as last fall, even against a schedule with two weaker opponents and significant mop-up time against the stronger opponent’s backups.
| OSU 2025 | Other Teams vs Opponents | OSU 2024 vs FBS | Other Teams vs Opponents | |
| Yards/Rush | 3.9 | 4.79 | 3.74 | 4.1 |
| Yards/Non-Sack Carry | 4.42 | 5.47 | 4.29 | 4.77 |
| QB Non-Sack YPC | 7.06 | -6.39 | 4.73 | 6.12 |
| Non-QB YPC | 3.95 | 4.79 | 4.62 | 4.62 |
| Run Play % | 53.37% | 54.44% | 41.63% | 50.51% |
Obviously, losing your entire line and NFL tailback Ollie Gordon will do a lot to hinder you, but it’s been dramatic to say the least.
Defense
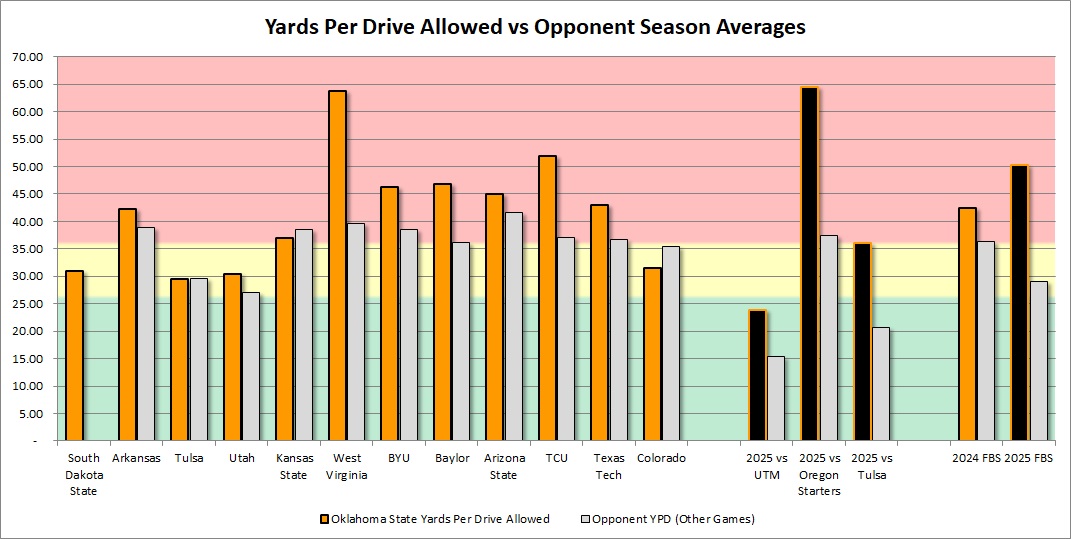
Oklahoma State’s defense was the major issue last fall, and it’s still struggling. They had respectable outings against UTM and Tulsa until you consider how poor those offenses have been in their other games. However, the outing at Oregon was basically as bad as the Ducks wanted to make it. Nearly two-thirds of the field per drive. Now, Oregon’s other opponent comparison is likely undervalued due to blowouts and backups, but even still, that is basically no disruption to the offense at all.
Defensive Overview Stats
Much like the offense, the numbers are bad. Yards, red zone, turnovers, scoring percentages, third downs... It’s all bad.
| OSU 2025 | Other Teams vs Opponents | OSU 2024 vs FBS | Other Teams vs Opponents | |
| Yards Per Drive | 43.77 | 23.07 | 42.47 | 36.49 |
| Points Per Red Zone Trip | 5.86 | 5.45 | 5.08 | 5.1 |
| Turnovers Per Game | 0.67 | 1 | 1.27 | 1.47 |
| Yards Per Play | 6.53 | 5.8 | 6.88 | 5.97 |
| Total Yards | 426.67 | 298 | 510.82 | 406.15 |
| % of Drives Scored | 45.45% | 27.1% | 46.62% | 42.44% |
| % Turnover Drives | 6.06% | 7.74% | 10.53% | 12.96% |
| 3rd Down % | 43.48% | 41.32% | 47.8% | 41.12% |
| 3rd or 4th Down % | 52.17% | 52.89% | 57.86% | 49.83% |
They have had a hard time getting off the field on third down. Oregon and Tulsa leveraged third and fourth down to extend drives well. Last fall, they had at least some success with it.
Defensive Passing Game
They are pretty similar to last fall in pass defense. They don’t get to the QB or pick opposing QBs as easily, but limit completions to slightly less.
| OSU 2025 | Other Teams vs Opponents | OSU 2024 vs FBS | Other Teams vs Opponents | |
| Completion % | 65.38% | 68.26% | 63.59% | 61.45% |
| Yards/Att | 8.29 | 6.95 | 8.6 | 7.67 |
| Yards/Completion | 12.69 | 10.19 | 13.52 | 12.49 |
| Yards Pass Play Including Sacks | 7.74 | 6.39 | 7.6 | 6.86 |
| Sack % | 4.88% | 3.62% | 5.88% | 5.51% |
| INT % | 1.22% | 1.97% | 2.81% | 2.52% |
Defensive Run Game
The run defense was horrendous last fall, and while their assignment discipline in run fits has improved, their talent dropped off massively, so the numbers are still bad.
| OSU 2025 | Other Teams vs Opponents | OSU 2024 vs FBS | Other Teams vs Opponents | |
| Yards/Rush | 5.36 | 4.75 | 5.47 | 4.39 |
| Yards/Non-Sack Carry | 5.66 | 5.22 | 6.22 | 5.04 |
| QB Non-Sack YPC | 5.61 | 5.26 | 7.49 | 5.96 |
| Non-QB YPC | 5.67 | 5.21 | 6.02 | 5.04 |
| Run Play % | 58.16% | 50.73% | 52.14% | 49.05% |
Below is a chart of the average yards per carry for running backs, where the stacked bars represent the yardage per carry. The top of the stacked bars is what 2-4 or so gains of 16-plus contribute to the average, while every other carry is at the base of the stacked column. This determines whether it’s a couple of long runs that spike an otherwise bad average or if it’s a reliable and consistent attack.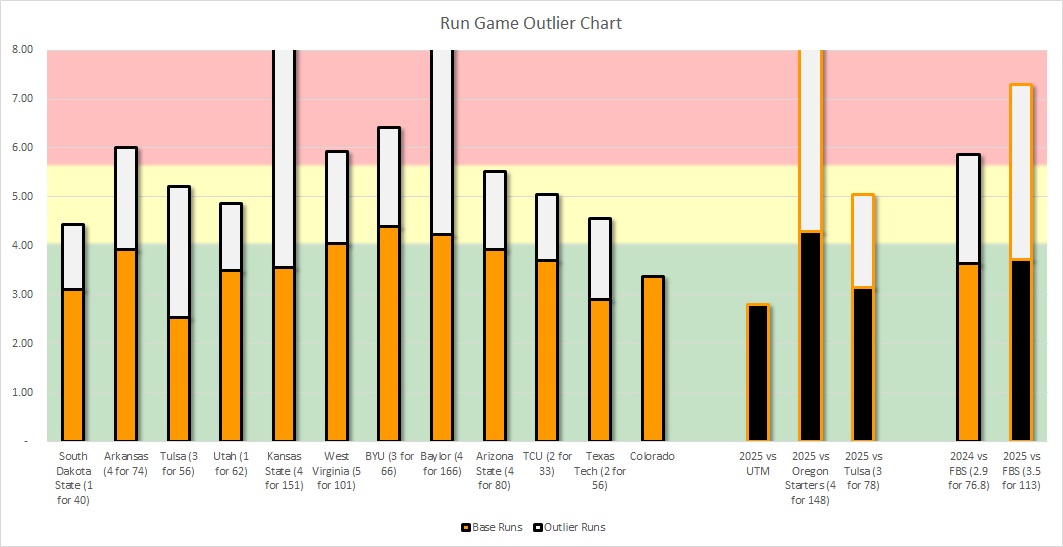
While the top number is still bad, they have at least shown some ability to stop teams on standard runs, although the explosive runs by Oregon and Tulsa boost the averages. The middle of last fall, when KSU, WVU, BYU, Baylor, ASU and TCU all consistently ran for successful yards even without the outliers, shows how bad it was. I do think they’ve improved some here, but it’s offset by the personnel dropoff.
Special Teams & Field Position
As a special teams unit, they are limited in the return game again, but do a decent job limiting opposing returns. They lose the field position by a narrower margin than last fall.
| OSU 2025 | Other Teams vs Opponents | OSU 2024 vs FBS | Other Teams vs Opponents | |
| Kick Return Average | 16 | 23.29 | 18.62 | 19.89 |
| Punt Return Average | 5 | 6.75 | 6.77 | 12.53 |
| Opponent Kick Return Avg. | 14 | 21.8 | 19 | 21.88 |
| Opponent Punt Return Average | 7.5 | 9.43 | 6.4 | 10.55 |
| Average Field Position | 74.47 | N/A | 73.5 | 70.73 |
| Opponent Average Field Position | 73.25 | N/A | 68.59 | 70.04 |
| Touchback Kickoff % | 50% | 55.81% | 44.44% | 56.5% |
| Opponent Touchback Kickoff % | 73.68% | 53.06% | 37.84% | 50.56% |
Below is a comparison of yards per drive with the average advantage in starting field position stacked on top of the team that won that battle. It provides an idea of the “hidden yards” and how they contribute to success.
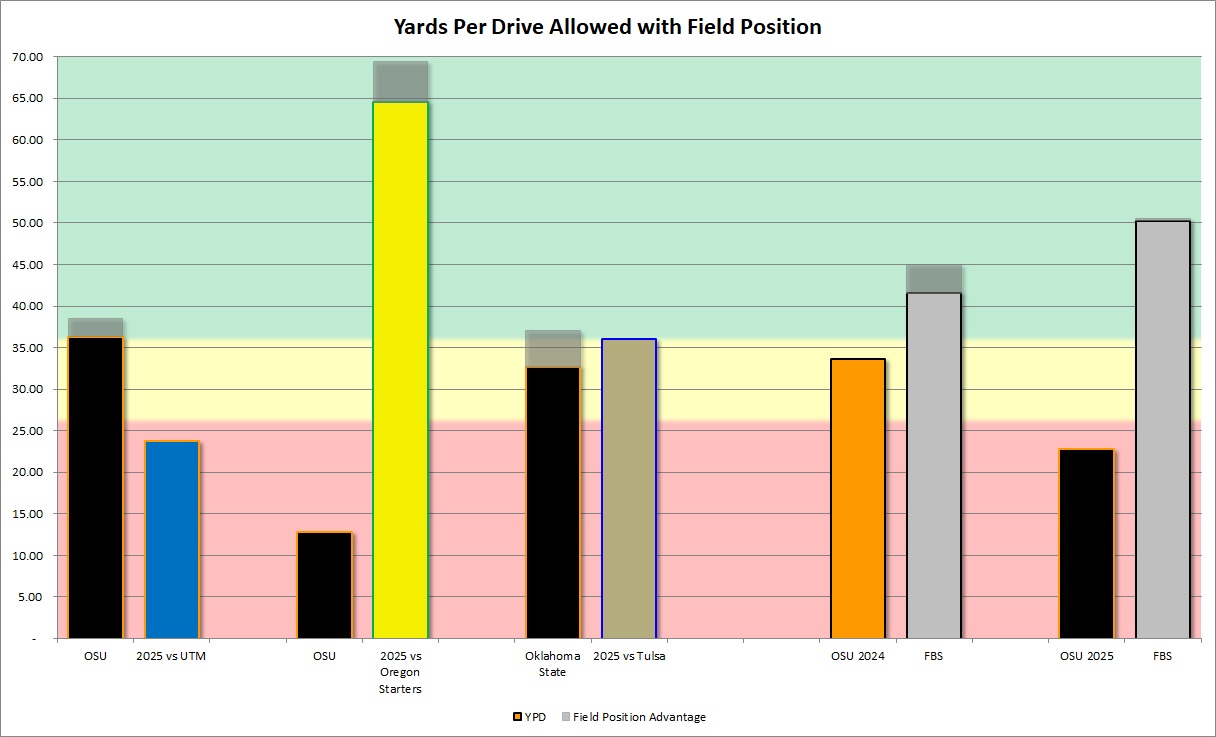
This highlights how they benefited from it against Tulsa and UTM, but Oregon’s blowout of the Cowboys was even worse, with the field position advantage, which mirrored how most of 2024 had the OSU Cowboys having to travel farther than their opponents, who already outgained them.
Final Thoughts
- It’s sad to see a very capable coach who elevated a program get taken down by the fundamental changes that NIL and the portal bring. He was very good at talent evaluation, player development and gameplanning for a long time. Whether he wouldn’t adapt, OSU wouldn’t adapt, or some combination thereof, he didn’t suddenly forget how to do all these things.
- The loss of Hejny was big. It would not be a silver bullet, but it would likely lead to more of a Garrett Greene at WVU-style offense that might not be a great passing team, but could formation you enough to stay on the field and leverage the QB run to stress the defense in ways they either cannot do now or, due to depth, are reluctant to.
- Defensively, it’s still a mess, but there are signs of some improvement in run fits, even if the talent is much worse. Reminds me of a degree in 2011 with Phil Bennett. Baylor had lost NFL nose tackle Phil Taylor, three starting linebackers, both starting safeties, and an NFL draft pick at corner, and Bennett got them to be much more sound against the run despite having to shift McAlister from LB to DE, Robertson from DE to DT, and Dixon from safety to STAR.
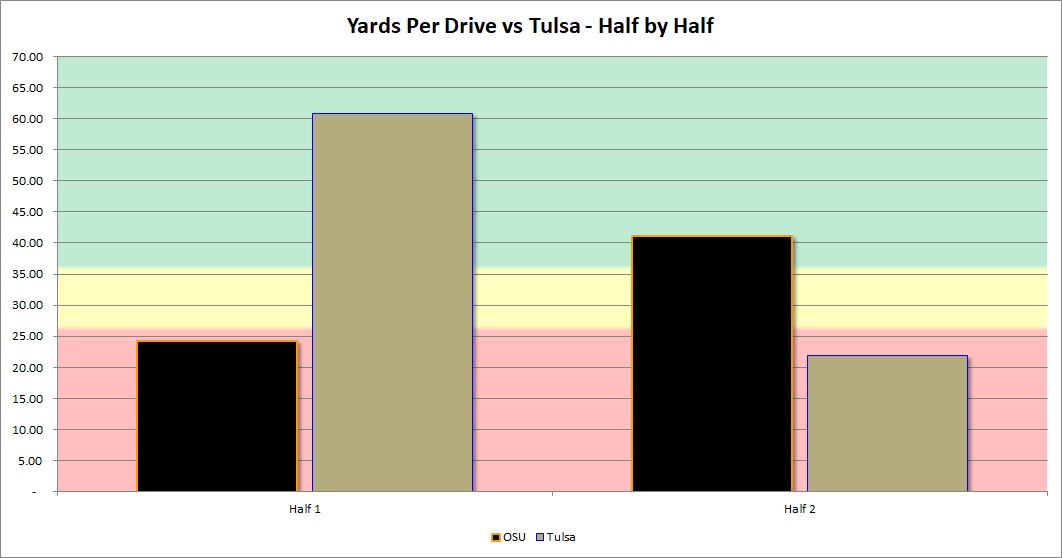
- If there’s reason for any optimism in Stillwater, it’s half two against Tulsa. They moved it well and stopped Tulsa yardage-wise, like you would have expected prior OSU teams to do. The problem was that they got whipped in the first half.
- OSU could be rallying the troops under Doug Meacham, or they could fold. The last time that guy was on an interim staff that BU faced was in 2021, and TCU upset the Bears. Baylor needs to end this one early.