Baylor faces it's toughest test of it's season so far as the Bears head to Norman, Oklahoma to take on the Sooners. After last year everyone knows the Sooners have a great offense but have struggled on defense. The question is how much would either detail change from last year to this year? Let's take a look at the stats to see what they tell us.
Offense
The Sooners were the most dominant offense in the country last fall and the best I have seen the Sooner offense in my lifetime. They averaged just under 20 yards more per drive than other Power 5 offenses averaged against their power conference opponents. To put it in context, the 2017 Sooners margin over expectations was nearly double what the famed 2008 offense put up.
Last year, however, was just that; last year. What has the start of 2018 told us about how well the Sooners replaced Mayfield, Andrews, Brown, Flowers and others? Below is a quick glance at yards per drive which won't skew as much as total yards or yards per play with number of possessions or style of play. As we are early in 2018, the comparison figures are mostly against all opponents as there aren't enough 2018 games against P5 teams to provide a big enough sample to tell much.
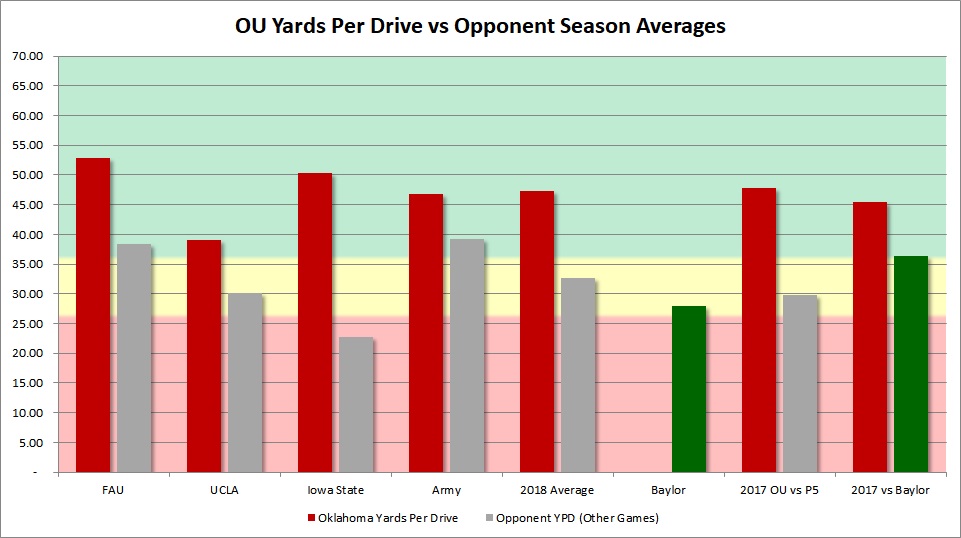
In yards per drive the Sooners are still rolling. None of their opponents have held the Sooners close to what they held other teams. The Sooners bulldozed all four opponents so far but aside from ISU it's hard to rate any of them above average given mediocre to bad results in other games.
For context I have included Baylor's results in other games defensively, the 2017 OU offense against P5 teams, and the results from last year's BU-OU matchup.
The Sooners still have a roughly 13-yard margin above what other teams average which is outstanding but not quite the buzzsaw 2017 was. They are very effective in the red zone although their opposition has given up significantly more points (5) per trip than what is typical.
They do a great job on turnovers and third downs. With all of this as a prelude, it should come as no surprise that their scoring percentage is nearly double what their opponents allow to other schools.
| Oklahoma 2018 | Other Teams vs Opponents | |
| Yards Per Drive | 45.39 | 32.59 |
| Points Per Red Zone Trip | 5.81 | 5.65 |
| Turnovers Per Game | 0.75 | 1.08 |
| Yards Per Play | 8.37 | 5.41 |
| Yards Per Game | 502.25 | 357.79 |
| % Of Drives Scored | 60.94% | 33.56% |
| 3rd Down % | 55.56% | 40.48% |
Offensive Passing Game
The Sooner passing game is efficient and explosive. They complete 10% more passes, have a yards per attempt that is nearly as high as other teams average per completion, and allow very few sacks as a percentage. They average a first down per pass play even when sacks are included. The only statistic listed where they "struggle" is interception percentage where they throw less than one percent more than other teams have against their opponents.
| Oklahoma 2018 | Other Teams vs Opponents | |
| Completion % | 68.63% | 58.54% |
| Yds/Att | 11.3 | 7.6 |
| Yds/Comp | 16.47 | 12.98 |
| Yards/Pass Play Including Sacks | 10.58 | 6.77 |
| Sack % | 3.77% | 6.27% |
| Int % | 1.89% | 1.25% |
Offensive Run Game
This is what seperates Lincoln Riley's Sooner offense from other Air Raids. This running game is dominant and simply averages elite yardage per carry through all of the metrics below with over 6 in each.
| Oklahoma 2018 | Other Teams vs Opponents | |
| Yards/Rush | 6.2 | 3.8 |
| Yards/Non-Sack Carry | 6.62 | 4.29 |
| QB Non-Sack YPC | 7.74 | 5.43 |
| Non-QB YPC | 6.54 | 4.05 |
| Run Play % | 55.83% | 54.76% |
Defensive Overview Stats
For all of the hype surrounding the Sooner offense the big question has been Mike Stoops and the defense. Have the Sooners improved from 2017 where defensive struggles turned roughly half their games into close contests?
In terms of yards per drive the Sooners have one great performance and three that are worse than expectations. FAU was a dominant effort against an offense that is one of the best in the G5 conferences where the Sooners held them 15.7 yards per drive under what they otherwise average. Aside from this the defense has underperformed. UCLA averaged 9 yards more than Cincinnati & Fresno St. gave up to them and Iowa State gained 22 more yards than they gained against Akron & Iowa. Army has been a productive offense but took it to another level averaging 48 yards per drive against OU.
Like we saw above, I have included Baylor's averages so far, the 2017 Sooners vs P5 teams, and the 2017 results from BU-OU. Since Army is a triple-option team I omitted them from the 2018 average as I don't believe that game tells us anything meaningful for this week's matchup.
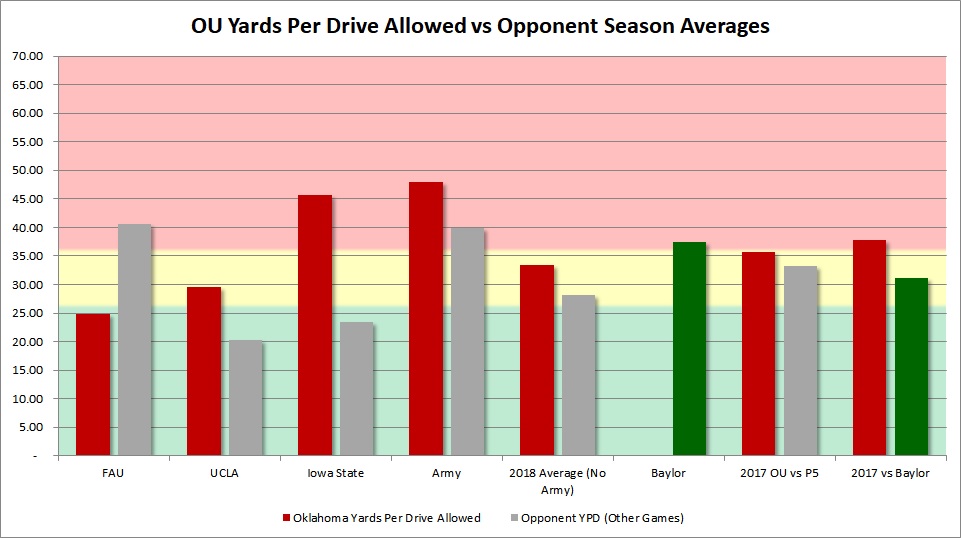
It's early in the season so the sample sizes are low, but this would indicate that if Baylor's line can hold up reasonably well against OU's talented line there could be a big opportunity for Baylor's offense to make some plays.
Defensive Overview (Omits Army)
The Sooner defense has been bad in the red zone even when two mop up scores are omitted. They don't force many turnovers but do a better than expected job denying scores and third down conversions.
| Oklahoma 2018 | Other Teams vs Opponents | |
| Yards Per Drive | 33.37 | 28.16 |
| Points Per Red Zone Trip | 5.67 | 5.19 |
| Turnovers Per Game | 0.67 | 2 |
| Yards Per Play | 5.37 | 5.29 |
| Yards Per Game | 384.67 | 358.28 |
| % Of Drives Scored | 26.32% | 32.03% |
| 3rd Down % | 31.82% | 34.66% |
Defensive Passing Game (Omits Army)
Their passing defense has beein statistically the biggest struggle. They allow more yards per attempt, completions, and pass plays than you would expect. They do a better job than expected on sacks but aren't as proficient in interceptions compared to other teams who faced their opponents.
| Oklahoma 2018 | Other Teams vs Opponents | |
| Completion % | 62.77% | 63.99% |
| Yds/Att | 8.57 | 6.48 |
| Yds/Comp | 13.66 | 10.13 |
| Yards/Pass Play Including Sacks | 7.28 | 5.75 |
| Sack % | 8.74% | 6.08% |
| Int % | 1.94% | 3.12% |
Defensive Run Game (Omits Army)
Against conventional schemes the Sooners have been solid in run defense statistically. Their opponents are held to under four yards per non-sack carry. The Sooners held Iowa State standout tailback David Montgomery to 82 yards and 3.9 per carry.
| Oklahoma 2018 | Other Teams vs Opponents | |
| Yards/Rush | 2.88 | 4.24 |
| Yards/Non-Sack Carry | 3.61 | 4.84 |
| QB Non-Sack YPC | 4.13 | 6.67 |
| Non-QB YPC | 3.53 | 4.71 |
| Run Play % | 52.09% | 50% |
Return Game
The Sooners are very good in the return game and blow away what other teams do to their opponents. Their coverage units have been solid in kickoff coverage but only faced two punt returns for -1 yard. They average roughly the same field position as their opponents who otherwise tend to face a 4 yard gap with their opponents.
| Oklahoma 2018 | Other Teams vs Opponents | |
| Kick Return Average | 31.75 | 16.31 |
| Punt Return Average | 14.5 | 7.36 |
| Opponent Kick Return Average | 15 | 22.57 |
| Opponent Punt Return Average | -0.5 | 11.04 |
| Average Field Position | 67.9 | 69.1 |
| Opponent Average Field Position | 69.1 | 73.6 |
Conclusion
The Sooners appear statistically very similar to last year. They are certainly one of the best teams in the country but you also see some vulnerability that could prevent them from reaching the goals that they and their fans are clearly setting their sights on. They will be a massive challenge for the 2018 Bears this Saturday.