
Good stuff, thanks for your time & effort to do this
Photo by Jim Black
Baylor Football
S11 Stats Review: How does BU compare to last year at the off week?
With no game this week it makes sense to take a look at the stat sheet and see how much progress Baylor has made since last fall.
Offense
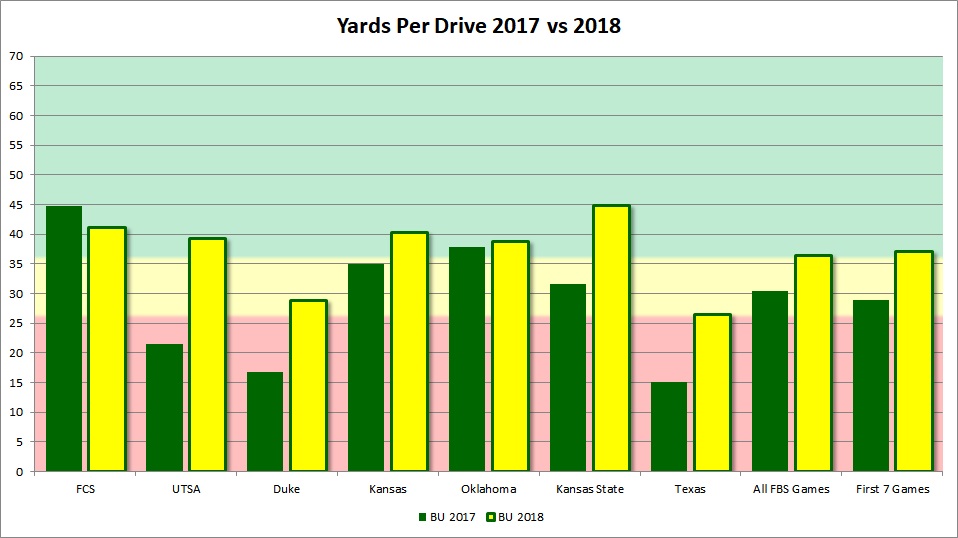
The biggest improvement on this team is offensively. Below is the yardage per drive in each game against either teams both played or against the FCS team either played. The Bears simply move the ball far better than they did in 2017. They average 35.8 yards per drive against P5 teams compared to 31.2 last year. That's now 103% of what other P5's do to them compared to last year's 94%. Even with a terrible half against Duke keeping the average low (BU was 40+ in half two) the improvement is obvious against every common opponent.
The following stats only include FBS competition.
Offensive Overview Stats
The offensive improvement is everywhere here. The red zone efficiency is up by 1.5 points per trip, the turnovers are cut in half, and the score and third down percentages are up.
| Baylor 2018 vs FBS | Baylor 2017 vs FBS | |
| Yards Per Drive | 36.4 | 29.84 |
| Points Per Red Zone Trip | 5.45 | 3.89 |
| Turnovers Per Game | 1.17 | 2.09 |
| Yards Per Play | 5.64 | 5.33 |
| Yards Per Game | 453.17 | 393.36 |
| % Of Drives Scored | 40% | 32% |
| 3rd Down % | 50.78% | 32.76% |
Offensive Passing Game
Both offenses leaned heavily on the passing game and while 2017 isn't far behind they trail 2018 in completion percentage, yards per pass play, sack percentage, and interception percentage. The yards per completion is down but not by much. I believe this to be related to opponents scheming against the big pass play more often.
| Baylor 2018 vs FBS | Baylor 2017 vs FBS | |
| Completion % | 61.92% | 59.03% |
| Yds/Att | 7.24 | 7.35 |
| Yds/Comp | 11.69 | 12.45 |
| Yards/Pass Play Including Sacks | 6.26 | 6.23 |
| Sack % | 7.47% | 7.69% |
| Int % | 1.42% | 2.56% |
Offensive Run Game
Both teams struggle to run it successfully. 2018 leads 2017 in virtually every efficiency category but still needs to improve.
| Baylor 2018 | Baylor 2017 vs FBS | |
| Yards/Rush | 3.77 | 3.23 |
| Yards/Non-Sack Carry | 4.78 | 4.34 |
| QB Non-Sack YPC | 5.94 | 5.07 |
| Non-QB YPC | 4.44 | 4.15 |
| Run Play % | 41.7% | 42.36% |
Defense
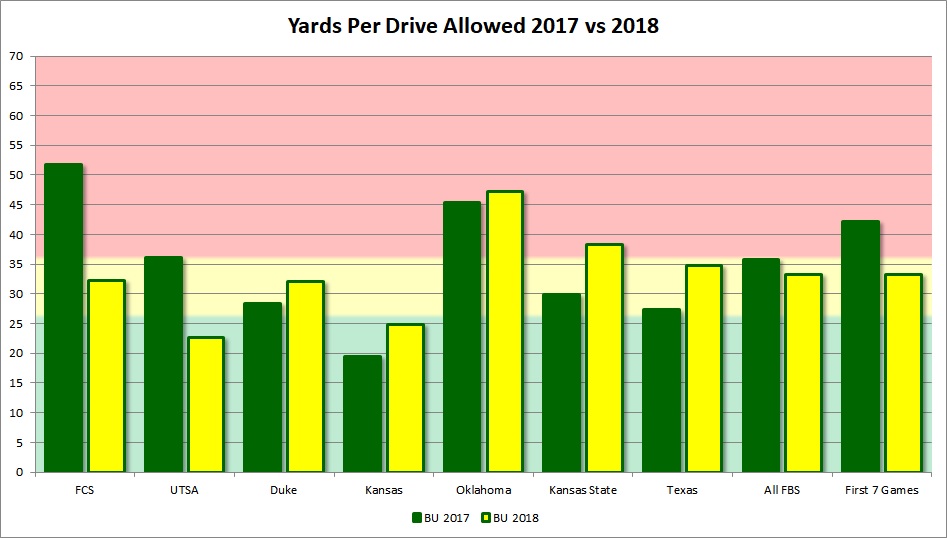
The defense has been the weaker side of this team in both years. However 2018 has seen signs of improvement. Below is the yardage per drive in each game against either teams both played or against the FCS team either played. The Bears have performed better against their first 6 FBS opponents in 2018 than they did over the entire season in 2017 even after the defense took some strides late in the year. When you compare the first seven games (FCS and FBS) against each other it's not even close. Baylor 2018 has done this against a schedule with a similar Oklahoma offense and improved Texas, Kansas, and KSU offenses as far as YPD is concerned that outperform last year in both YPD and % of what other P5's get against their opponents. It's nowhere near what they need it to be but it's better than it was.
This next section is going to be generous to the 2017 team by omitting their results against Liberty by only comparing games against FBS teams.
Defensive Overview Stats
The defense has been better in the red zone and score percentage. It's been worse on third down.
| Baylor 2018 vs FBS | Baylor 2017 vs FBS | |
| Yards Per Drive | 33.32 | 35.83 |
| Points Per Red Zone Trip | 4.56 | 4.84 |
| Turnovers Per Game | 0.83 | 1 |
| Yards Per Play | 6.4 | 6.57 |
| Yards Per Game | 398.17 | 445.27 |
| % Of Drives Scored | 42% | 46% |
| 3rd Down % | 44.48% | 35.18% |
Defensive Passing Game
The passing defense is better so far even without Liberty skewing things against the 2017 squad. The completion percentage is down, the yards per pass play is down a full yard, sacks are up, and interceptions have doubled.
| Baylor 2018 vs FBS | Baylor 2017 vs FBS | |
| Completion % | 57.82% | 64.72% |
| Yds/Att | 7.7 | 8.46 |
| Yds/Comp | 12.83 | 13.07 |
| Yards/Pass Play Including Sacks | 6.55 | 7.54 |
| Sack % | 7.01% | 6.05% |
| Int % | 2.03% | 0.86% |
Defensive Run Game
2018 has been struggling on the ground statistically due to several long runs. The KSU game was a huge outlier and so much so that you can see the stats comparison flips with and without their inclusion. Baylor has had solid stretches on the ground holding OU's tailbacks to 3 yards per carry through three quarters, holding KU to 1.5 per carry outside of one long run, and holding UT tailbacks to 3.9 outside of one 30 yard carry. However consistency is the key and they have to keep improving. Outlier stats can show how they are close but they need to take the next step. The KSU game was inexcusable on the ground.
| Baylor 2018 vs FBS | Baylor 2017 vs FBS | Baylor 18 No KSU | |
| Yards/Rush | 5.36 | 5.1 | 4.81 |
| Yards/Non-Sack Carry | 6.47 | 5.71 | 5.46 |
| QB Non-Sack YPC | 6.65 | 6.6 | 6.56 |
| Non-QB YPC | 6.58 | 5.84 | 5.39 |
| Run Play % | 49.71% | 53.49% | 49.16% |
Special Teams
The Bears have gotten better at limiting opposing kickoff return averages in 2018 and have remained laregly the same in the other return game stats. However better efficiency on turnovers has contributed to a more equitable split on field position. The Bears have cut their "hidden yards" disadvantage in half.
| Baylor 2018 vs FBS | Baylor 2017 vs FBS | |
| Kick Return Average | 18.36 | 17.91 |
| Punt Return Average | 4 | 8.57 |
| Opponent Kick Return Average | 18.56 | 24.7 |
| Opponent Punt Return Average | 6 | 2.95 |
| Average Field Position | 72.98 | 72.07 |
| Opponent Average Field Position | 71.16 | 69.04 |
Conclusion
As most of us have observed with our own eyes there's a lot of improvement offensively but the defense is coming along more slowly. Big plays continue to be a problem which inflates yards per play. The Bears have five more games to play and should be able to be competitive with all the teams on their schedule if they play reasonably well. It's up to the Bears to go win at least two.
Never miss the latest news from SicEm365!
Join our free email list