
Not seeing the Stills brothers is enough for me.
Photo by Cole Tompkins - SicEm 365
This is part two of my Baylor vs. WVU preview covering stats. The first part covered their roster and the final part will cover their X’s and O’s.
What Can The Numbers Say About Neal Brown’s Mountaineers?
WVU has had an interesting season with different starting QB's, a replacement at Defensive Coordinator and several close games. What do the stats say about them this fall?
Below is a combination of charts and tables to help us understand the resume so far. The tables have WVU against their P4 opponents compared to other P4 teams against those same opponents. For comparison, I have split out the offense by which QB was playing and the defense by which coach was DC for the game. The charts will have a given metric with WVU in blue with either the opponent in the opponent's colors or other FBS teams against their schedule in gray. The backgrounds will be shaded green, yellow or red, respectively, to indicate whether a metric is performing well, average or poor. How teams performed against Baylor will be in green bars if applicable.
Offense
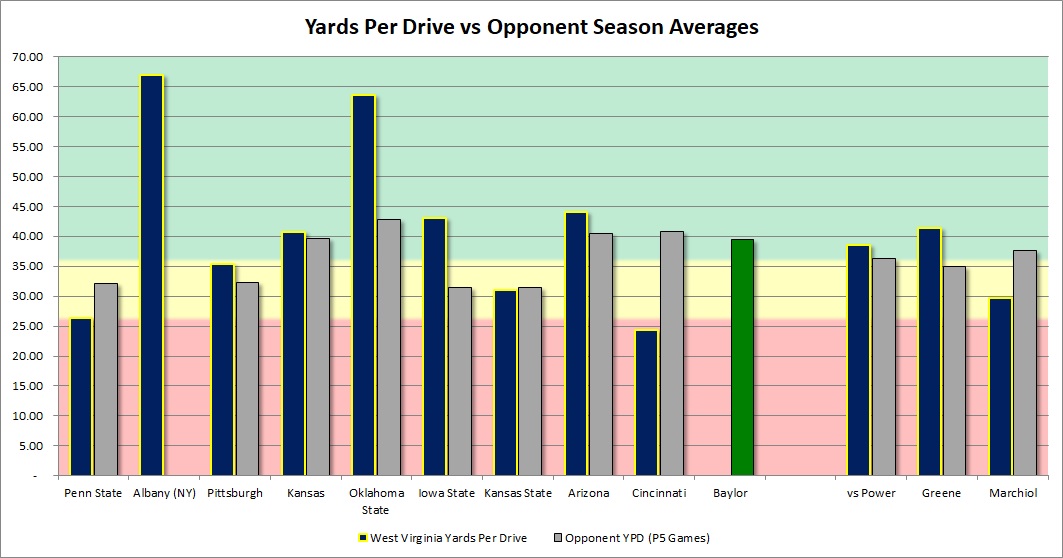
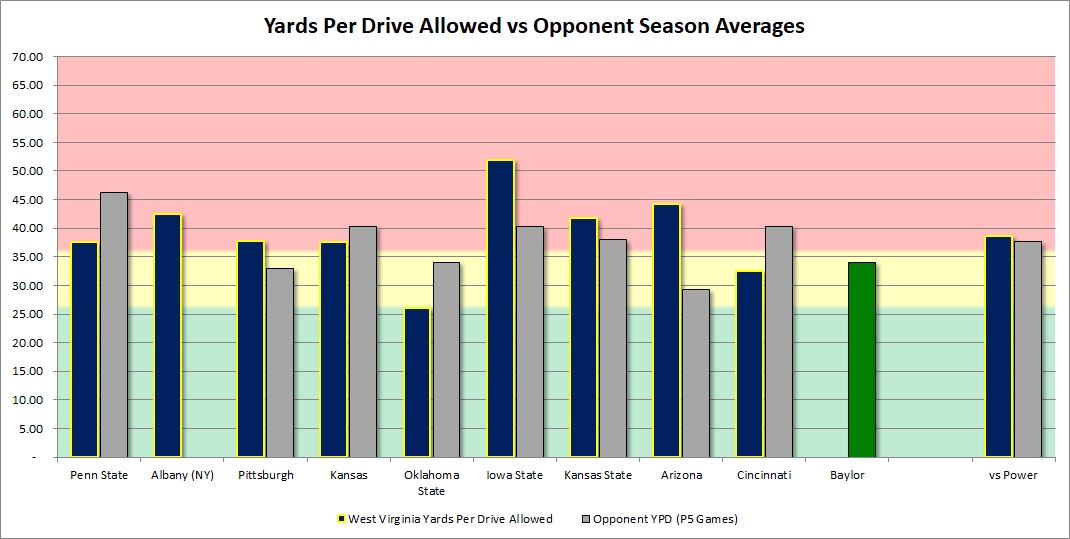
In yards per drive they have been a pretty solid offense. They underperformed against CIncinnati, KSU, and PSU but did well in the rest of the games including an absolute destruction of Oklahoma State and a great output against ISU.
Offensive Overview Stats
The offense was more productive but did worse on turnovers and red zone efficiency with Garrett Greene running things. His backup Nicco Marchiol has played the last two and a half games and while the yardage is way down per drive (20.6 vs KSU, 44 vs Arizona, 24 vs UC) they have gone 2-0 the last two weeks. With Greene they are much more difficult to stop on third down but again- turnovers matter too and both sets of opponents turn teams over at similar rates.
| Greene | Other P4 vs FBS Opponents | Marchiol | Other P4 vs FBS Opponents | |
| Yd Drive | 41.44 | 35.1 | 29.67 | 37.86 |
| Points Per Red Zone Trip | 4.85 | 4.81 | 6.5 | 4.87 |
| Turnovers Per Game | 2.17 | 1.53 | 0.33 | 1.37 |
| Yards Per Play | 5.62 | 5.88 | 4.71 | 6.15 |
| Total Yards | 410.17 | 392.92 | 259 | 392.69 |
| % Of Drives Scored | 42.86% | 37.17% | 35.71% | 40.65% |
| % Turnover Drives | 20.63% | 13.85% | 3.57% | 12.92% |
| 3rd Down % | 46.15% | 38.74% | 27.03% | 41.93% |
| 3rd or 4th Down % | 56.04% | 47.26% | 43.24% | 47.66% |
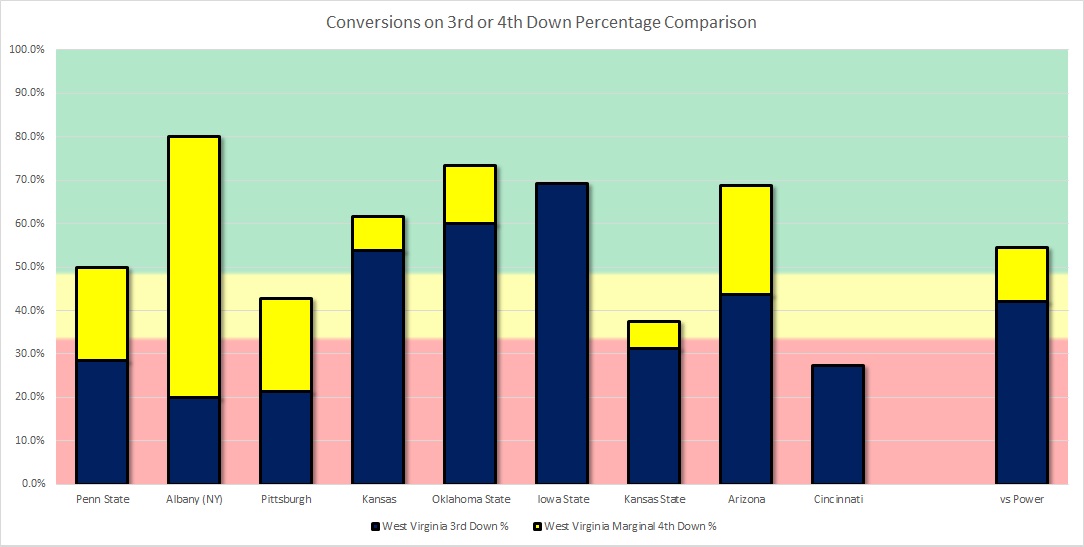
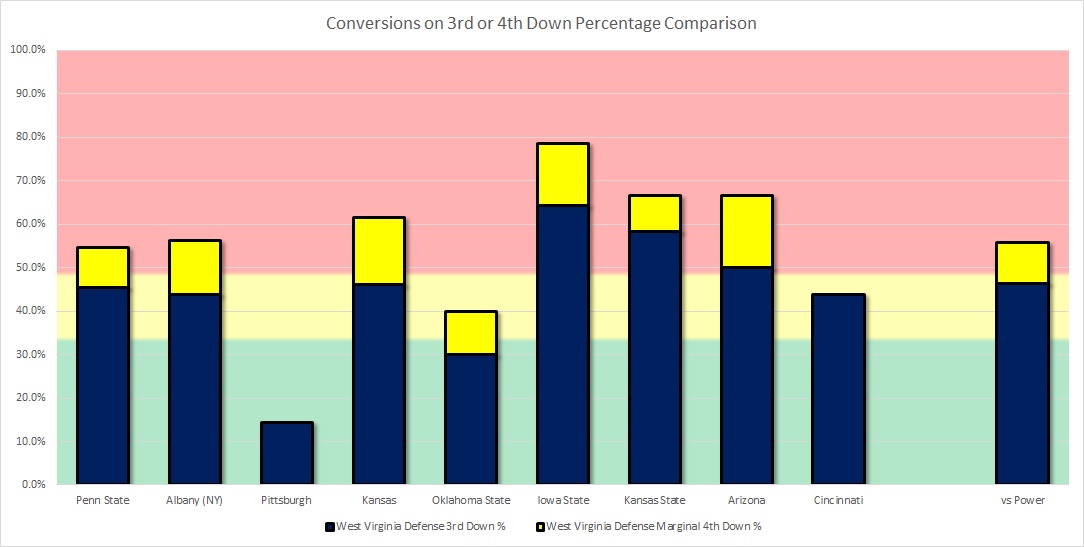
Below is a stacked bar chart of WVU's offensive third-down conversions by game on either third or fourth down. The percent converted on third down is in darker colors, while the fourth-down contribution is in lighter colors. This offense is usually pretty hard to get off the field on third or fourth down but struggled in a couple of games like KSU, Cincinnati, and PSU in that regard.
Offensive Passing Game
In the air, they are very different. Greene completes fewer passes but gets more per-completion while getting sacked less and throwing more interceptions. Marchiol protects the ball better, and completes more passes, but takes a heavy amount of sacks.
| Greene | Other P4 vs FBS Opponents | Marchiol | Other P4 vs FBS Opponents | |
| Completion Percentage | 52.87% | 60.93% | 61.9% | 63.71% |
| Yards/Att | 6.96 | 7.35 | 7.46 | 8.02 |
| Yards/Completion | 13.16 | 12.06 | 12.05 | 12.59 |
| Yards/Pass Including Sacks | 6.38 | 6.36 | 6.23 | 7 |
| Sack % | 5.43% | 6.79% | 10% | 6.45% |
| INT % | 5.98% | 3.28% | 1.43% | 1.93% |
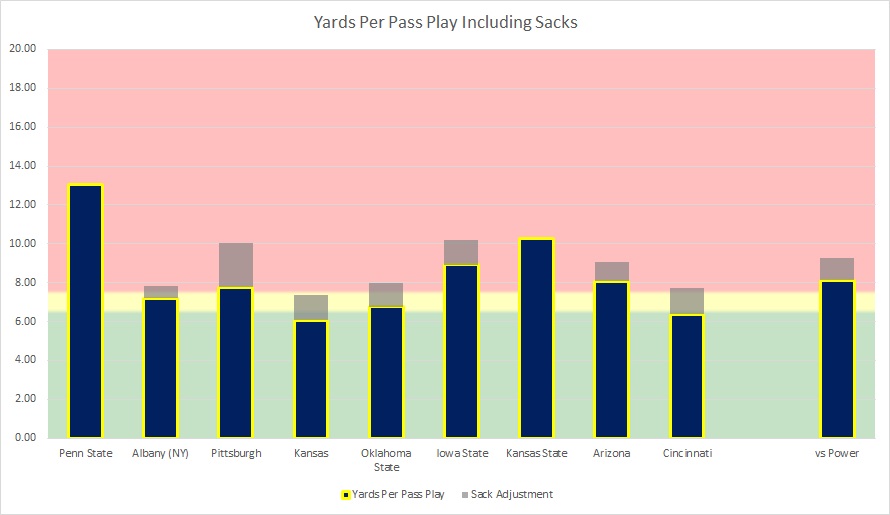
Below is their yards per pass attempt adjusted for sack yardage lost. The transparent bars are the sack differences between their raw yards per attempt and the sack-adjusted figure. Marchiol has a higher output than Greene in raw stats but the sack adjustment drags the net impact below Greene.
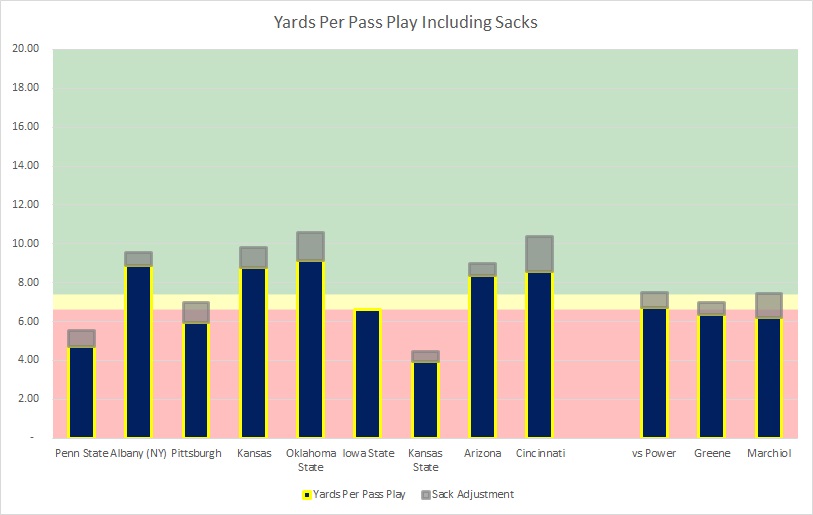
With that said they threw it pretty well in this metric the last two games.
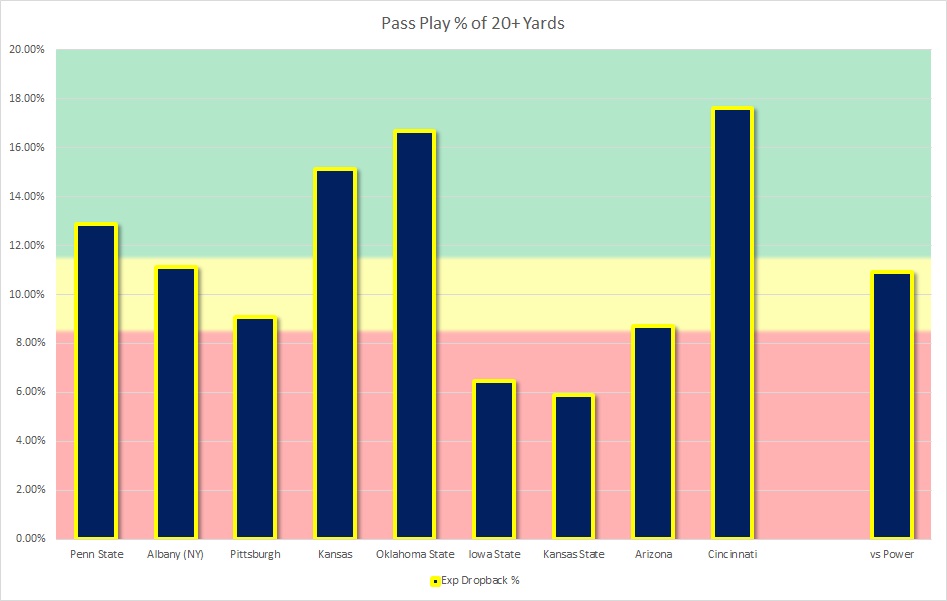
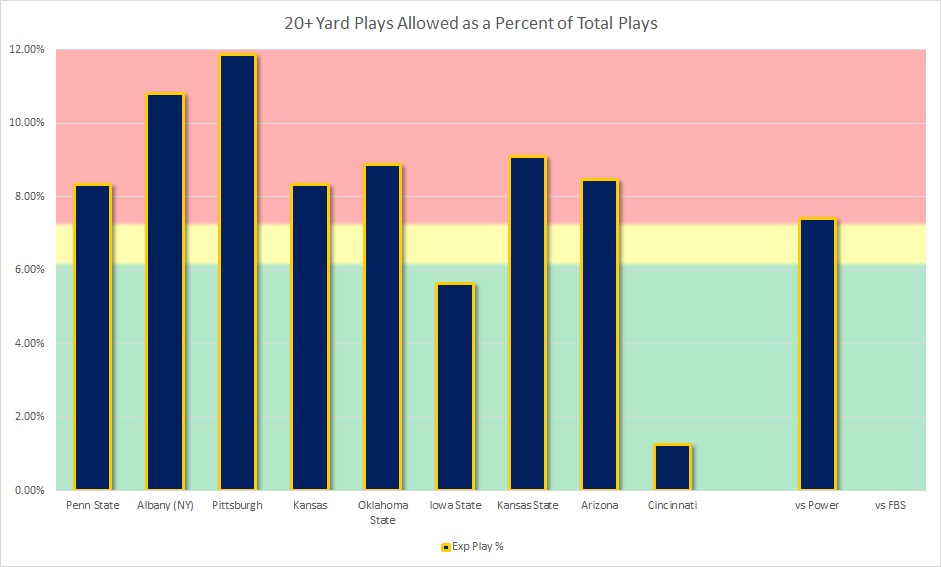
Below is the percentage of pass attempts or sacks that go for 20+ yards. WVU had three bad games but can absolutely be explosive and did so really well in five of their games including KU, PSU, UC, and OSU.
Offensive Run Game
The run game is different with these two as well. The added threat of the de-facto punt returner athlete Greene under center makes their run game go better. Marchiol is a better passer than Greene but the per-carry stats are all favoring the main guy as he forces the defense to account for him more, even against a very similar slate of defenses.
| Greene | Other P4 vs FBS Opponents | Marchiol | Other P4 vs FBS Opponents | |
| Yards/Rush | 4.73 | 4.5 | 3.01 | 4.49 |
| Yards/Non-Sack Carry | 5.07 | 5.36 | 3.59 | 5.3 |
| QB Non-Sack YPC | 7.26 | 6.29 | 2.94 | 5.78 |
| Non-QB YPC | 4.28 | 5.26 | 4.08 | 5.37 |
| Run Play % | 57.99% | 48.11% | 57.58% | 49.66% |
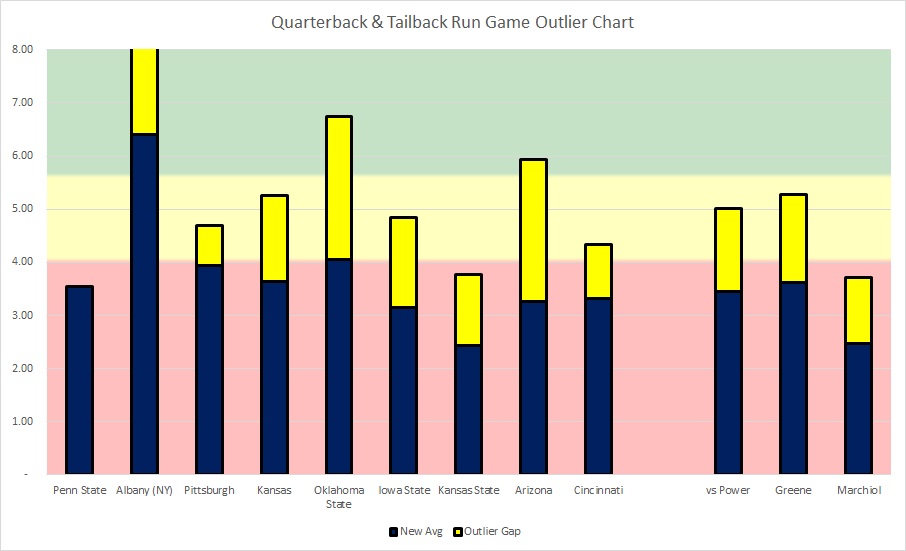
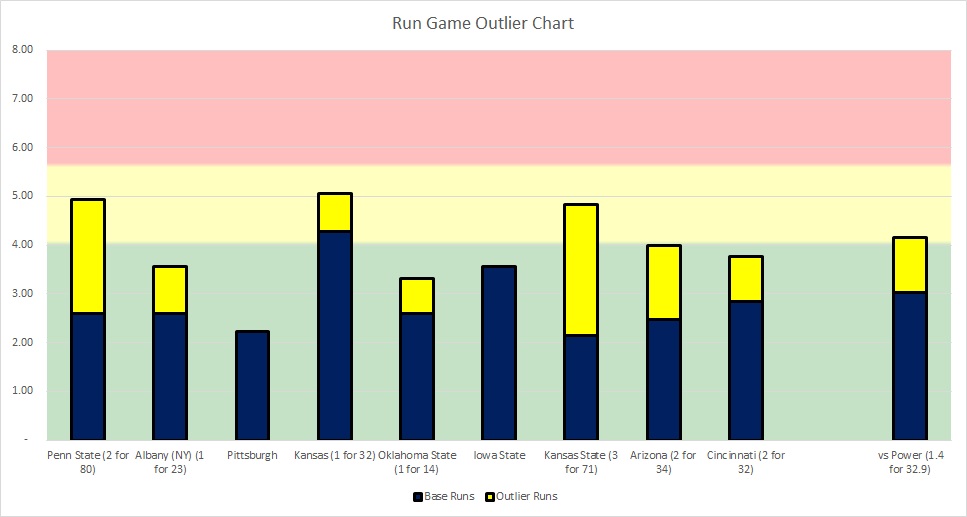
Below is a stacked chart where the combined bars are the tailback or quarterback yardage per carry, and the lighter-colored bars at the top are the portion attributable to outlier runs of roughly 16-plus yards. With Garrett Greene in there they’ve been very productive while recent weeks with Marchiol has led to a step back on the ground. They combine a pretty decent base yards per carry under Greene with similar explosiveness to Marchiol’s time.
Defense
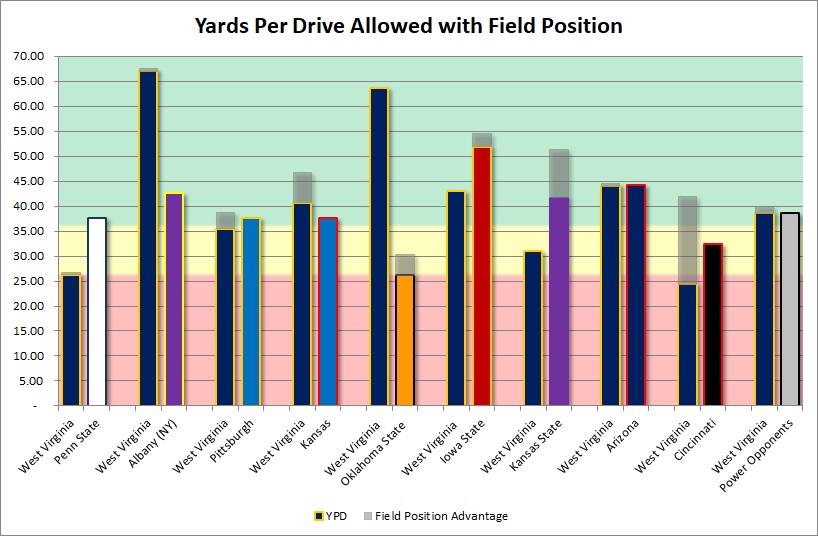
This defense has struggled enough to fire their DC and make a change. ISU, KSU, and Arizona put a hurting on this defense in terms of yards per drive. However game one under the new DC went pretty well against Cincinnati.
Defensive Overview Stats
The switch to Jeff Koonz as DC appears to have paid early dividends as they held Cincinnati better than the Bearcats typically track after being slightly worse in each metric in their first seven FBS games on average than a typical opponent for their schedule. The biggest change was forcing turnovers and the red zone defense. Time will tell if it’s a one-game blip or the start of a trend for them.
| Lesley as DC | Other P4 vs FBS Opponents | Koonz as DC vs UC | Other P4 vs UC | |
| Yards Per Drive | 39.55 | 37.28 | 32.5 | 40.24 |
| Points Per Red Zone Trip | 6.22 | 5.15 | 4.25 | 4.85 |
| Turnovers Per Game | 0.86 | 1.43 | 3 | 1 |
| Yards Per Play | 6.38 | 5.88 | 5.52 | 5.97 |
| Total Yards | 383.71 | 396.07 | 436 | 408.67 |
| % of Drives Scored | 45.45% | 40.26% | 33.33% | 49.18% |
| % Turnover Drives | 9.09% | 13.14% | 25% | 9.84% |
| 3rd Down % | 46.84% | 40.8% | 43.75% | 43.42% |
| 3rd or 4th Down % | 58.23% | 47.07% | 43.75% | 52.63% |
On third and fourth down it’s been pretty consistent for the opponent outside of the Pitt game and OSU game.
One major flaw for the defense this year has been explosive plays. They have had a hard time not letting opponents generate chunk plays. ISU and Cincinnati are the two games where they really didn’t but the rest has been alarming in this statistic.
Defensive Passing Game
In the air, they allow a lot of completions even compared to their schedule. The change last week is that they intercepted the ball more and the yards per completion were managed better and they lived to fight another down.
| Lesley as DC | Other P4 vs FBS Opponents | Koonz as DC vs UC | Other P4 vs UC | |
| Completion % | 65.05% | 59.53% | 69.44% | 65.67% |
| Yards/Att | 9.58 | 7.09 | 7.75 | 7.78 |
| Yards/Completion | 14.73 | 11.91 | 11.16 | 11.85 |
| Yards Pass Play Including Sacks | 8.47 | 6.5 | 6.38 | 7.2 |
| Sack % | 6.53% | 4.13% | 7.69% | 4.29% |
| INT % | 1.51% | 2.99% | 2.56% | 1.9% |
The opposing passers have been generally productive against this defense but the solid sack percentage takes a little bit off the adjusted yards per attempt- especially against Cincy and Pitt.
Defensive Run Game
Against the run they did a better job limiting Cincinnati after being pretty decent against the run under Lesley.
| Lesley as DC | Other P4 vs FBS Opponents | Koonz as DC vs UC | Other P4 vs UC | |
| Yards/Rush | 3.85 | 4.64 | 3.65 | 4.23 |
| Yards/Non-Sack Carry | 4.5 | 5.19 | 4.68 | 4.68 |
| QB Non-Sack YPC | 6.32 | 5.99 | 7.09 | 4.19 |
| Non-QB YPC | 4.43 | 5.18 | 3.76 | 5.02 |
| Run Play % | 52.73% | 47.28% | 50.63% | 48.91% |
Below is a stacked chart where the combined bars are the tailback yardage per carry, and the lighter-colored bars at the top are the portion attributable to outlier runs of roughly 16-plus yards. They’ve been pretty solid limiting base carries this year but had a harder time limiting chunk runs like KSU, Arizona, and PSU were able to hit.
Special Teams & Field Position
WVU tends to enjoy a one yard advantage in starting field position on their opponents and do a solid job on kickoff return and with their coverage units. They don’t force many touchbacks which gives opponents plenty of chances to return the ball.
| WVU vs P4 | Other P4 vs Opponents | |
| Kick Return Average | 22.79 | 19.62 |
| Punt Return Average | 7.82 | 8.04 |
| Opponent Kick Return Avg. | 17.36 | 21.04 |
| Opponent Punt Return Average | 3.33 | 10.23 |
| Average Field Position | 71.15 | 73.26 |
| Opponent Average Field Position | 72.55 | 71.2 |
| Touchback Kickoff % | 31.82% | 63.54% |
| Opponent Touchback Kickoff % | 55.81% | 52.98% |
Key Takeaways
- Takeaways. If Greene is there he will stress you more defensively than Marchiol but also coughs it up more. Take advantage either way.
- This offense is more dangerous on the ground with Greene and in the pure passing scenarios probably has a better shot with Marchiol.
- Defensively they allow a lot of completions and limit the run well. Their issues allowing big plays is likely a byproduct of their committing safeties closer to the line to make plays against the run.
- Their sack percentage and solid play against the run may force Baylor to lean more on the passing game this time.
- Given how good each coverage unit is on both sides and how often Baylor forces touchbacks it’s not a game where I expect a bunch of big returns despite Richard Reese shredding them last year.
Follow @Baylor_S11 on X!
Never miss the latest news from SicEm365!
Join our free email list