That being said, the real takeaway is that the viewership between the leagues is not dramatically different regardless as to who would be on topic, and that's the point. This isn't a Big 12 specific issue - the rest of the ACC viewership would struggle without FSU and Clemson on their schedules too.
Many college football writers have talked about the remaining eight schools in the Big 12 and how much television value is leaving as Texas and Oklahoma head to the SEC. Some discussion is what I consider to be fair.
However, other analysis doesn’t match up with some of the data I have seen. One article is Stewart Mandel’s article where he equates the remaining eight’s TV value with the American Athletic Conference. He makes a compelling case that looks reasonable with the data he presents, but additional non-discussed data makes a case that conflicts with his.
Mandel looks at two seasons — 2018 & 2019 — and which games fall under the home team’s TV deal. On it’s face this seems reasonable given that the networks technically “buy” the home team rights. He also looked at games involving ABC, ESPN and ESPN2 to avoid ESPNU’s low quality ratings and inventory, but to also avoid all FOX networks that the AAC has no relationship with.
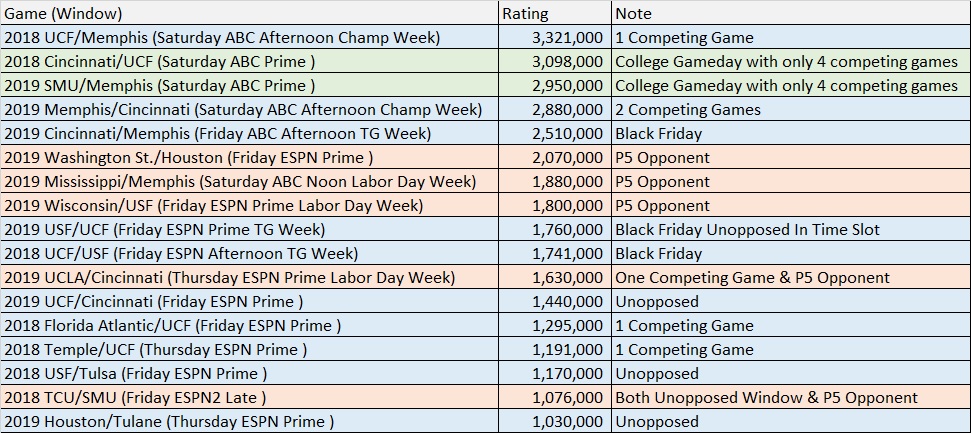
The issue comes in the form of the fact that the two-season sample he chose was one where the Big 12’s remaining eight schools had two games on ABC not involving Texas or OU. Meanwhile, during those same two seasons, the AAC had several on ABC and ESPN with favorable TV windows that had less competition in their time slot, had the buildup of ESPN’s College Gameday show, or benefited from TV windows with relatively few games competing in the same time slot.
Below you see that virtually all AAC games with more than one million viewers have some beneficial window or opponent. Just one of these games faced the usual five to seven or so competing games you see on a typical Saturday.
One of my major criticisms of how he arrived at his numbers is how his two-season sample skews the average based on which networks carries the inventory of games. The final number Mandel compares is after the AAC played roughly 16% of its game on ABC, 44% on ESPN and 39.5% on ESPN2.
On the other hand, the remaining eight Big 12 teams played 5% of its games on ABC, 54% on ESPN and 41% on ESPN2. The 5% on ABC is after the TCU-Ohio State game is omitted from Mandel’s number.
The five seasons leading up to Mandel’s selected time frame, from 2013-2017, and the season after in 2020, the remaining eight of the Big 12 teams averaged 19% of their ABC/ESPN/ESPN2 games on ABC. His sample was only 25% of that which leads to a massive difference when truly comparing data between the AAC and the remaining eight.
It’s important to consider the network a team plays on and the time of day for the data I used. Below is a look at how ABC, FOX, ESPN, ESPN2, ESPNU and FS1 typically perform on a normal Saturday excluding Labor Day weekend or championship week where ratings tend to inflate.
Below, games earlier than 2:00 pm ET time were listed the “noon” time slot, those kicking off before 5:30 pm ET were “afternoon”, and those before 9:45 pm ET were considered “prime”. Games coming later than 9:45 pm ET After fall into the late window.

We see that ABC is easily the best of this group while ESPN and FOX jockey for second place depending on whether you value the maximum, minimum or average values at different times of day. ESPN2 is next in line and FS1 is farther behind these as well and eventually FS2. Note: Fox’s afternoon slot is heavily skewed by 3 Michigan vs Ohio State games that averaged 12 million viewers. Without those games Fox resembles ESPN.
1. ABC
t-2. ESPN
t-2. FOX
4. ESPN2
5. FS1
6. FS2
Furthermore, there are some unique times in the season to play that can impact the overall ratings. Being on ABC in either the noon or afternoon time slot on Black Friday has a much higher ratings floor than a typical ABC Saturday game in those slots. Why? Very few competing games, if any. Similar dynamics are in play on Labor Day and on Championship Saturday.
To illustrate my point, let’s look at one of the most popular and widely discussed games of the season that involves an AAC team.
Army-Navy averaged a staggering 7.39 million viewers from 2013-2019 after they moved to their own weekend date with practically no competing games. Compare that to the 2020 game when the two played in a slot with four other games, the matchup averaged 4.9 million despite having a very desirable game.
Below is a comparison of a typical Saturday compared to these unique windows in terms of minimum rating.

Notably the worst ratings for both spots on Black Friday range from 1.5x and up to 3x the viewership of a typical Saturday. Why? These games are one of 2-4 games instead of a typical week where 6-7 games split the audience.
How do we compare apples to apples? We look at more than two seasons of TV data, we look at viewership on the same networks, and we also account for the TV windows games are played. To do this I took the data at Sports Media Watch and analyzed games beginning in 2013. This is when the AAC teams mostly started playing against each other.
I also split the viewers for games with regional coverage ABC broadcasts where only a certain percent of the nation gets that game on ABC. In other markets it’s either on ESPN2 or blacked out.
The percentage of the nation’s TV sets in the markets getting the game on ABC is multiplied by the ABC viewers and the remaining percentage is applied to the ESPN2 reverse mirror number.
Why? The game below between UNC-NC State combined to average 4.2 million viewers on ABC but it also combined to average 380,000 on ESPN2. In the absence of specific ratings by market, a percentage allocation of the TV sets across the markets with access to each game provides us a more fair estimate.
In this case, I estimated that 33.6% of the country had access to the the UNC-NC State game on ABC and 66.4% had access to it on ESPN2 for an estimated viewership of around 1.67 million. (Regional Coverage Map credit to ABC/ESPN)

One item Mandel correctly called out was the irrelevance of the gigantic TCU-Ohio State viewership as a barometer for the remaining eight as that might have more to do with the Buckeyes than the Frogs. My only criticism is that rule didn’t apply to Houston vs. Washington State, Ole Miss vs. Memphis and others.
Since non-conference can muddy the water, I’ll take it a step further. Let’s just look at the remaining eight of the Big 12 playing only each other compared to the AAC’s remaining 11 playing each other. No non-conference games for someone else to inflate or deflate the averages here.
Mandel used a combination of games on ABC, ESPN and ESPN2. FS1 was omitted from his comparison as (1) the AAC doesn’t appear on that network and (2) it’s generally a poor performing network that is worse than ESPN2 and barely does better than ESPNU.
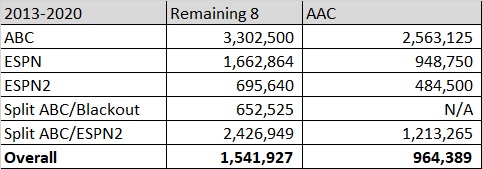
When you look beyond 2018-2019 the, the remaining eight Big 12 teams outpace the AAC here by a good margin of around 60% overall and outpaces the league on each network.
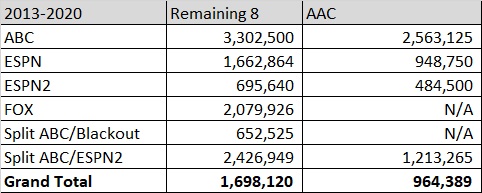
When you add FOX broadcasts, it becomes 75% more viewers. I included FOX as it’s received 13% of the remaining eight’s top 23% of inventory. ESPN and FOX split television rights and typically slot the best games on ABC or FOX usually.
However, until this point, this information is all from surface level. Let’s dig into the TV windows. For more data I'll bring in some 2012 for more apples to apples comparisons.
On ABC we see the remaining eight Big 12 programs winning the comparison in all windows except the Black Friday afternoon slot where the remaining eight’s only game was a 2012 matchup of 6-5 ISU vs 5-5 WVU that didn’t beat 2017's unbeaten UCF against a one-loss USF. However, it did manage to outpace 2019's one loss Memphis against one loss Cincinnati.
The noon slot on Championship Week saw none of the 2015 Houston-Temple, 2016 Temple-Navy, or 2017 UCF-Memphis championship games match TCU’s 2014 game against Iowa State. The Cyclones finished 2-10 that year.

On ESPN only one Saturday afternoon game for the AAC with unbeaten Cincinnati going against two-loss UCF. That rating beats the Big 12 average, but over half the Big 12’s 13 games in that window did better than that number.
Both leagues had one game in the ESPN noon time slot where 2015 Baylor against a struggling ISU team had a million more views than unbeaten Cincinnati taking on one-loss defending champ Memphis. The Big 12 did 300-400,000 more viewers on the ESPN2 windows.

One set of TV windows where the AAC has had 42% of their over one million viewer games are the low competition Friday and Thursday night windows on ESPN or ESPN2.
The Big 12 hasn’t had have many of these so to get a little more data I’ll allow games where the remaining eight played teams from C-USA, the Mountain West, the MAC or the Sun Belt. Once again we see the Big 12 schools outpace the AAC.
Even looking at games where Baylor played Rice, Louisiana-Monoroe, and Buffalo, not one AAC broadcast on ESPN Friday Night matched the average of those games.

On ESPN2 we see Oklahoma State against South Alabama blow away the AAC average for ESPN2 Friday nights and did better than all the AAC games in this sample other than 2015 Memphis against South Florida and 2015 Temple against SMU where Matt Rhule’s Owls were coming off a massive showdown with Notre Dame.
After that, the bulk of the AAC’s games are on ESPNU. These games don’t really draw eyeballs also lose the comparison against the remaining eight Big 12 programs. The Big 12 games on ESPNU average 2-3 times more in my data than AAC league games do.
No, the Big 12 Doesn’t Perform Equal To The AAC
Between the numbers above and the fact that another 40% of the AAC’s inventory is worse than this it’s not an apt comparison in my opinion. The Big 12 performs better in similar windows as we’ve seen above and there’s really no debate.
The only two windows where the AAC was ahead were where one side had only one game to compete and even then the AAC had some of their best inventory in those slots while the Big 12 didn’t with three of four teams involved being around .500 or worse.
Don’t Forget FOX
Since 2013, the second network TV partner of the Big 12, FOX has broadcasted the remaining eight more often than ABC, the main comparison and point of discussion between the Big 12 and AAC TV data.
Excluding Oklahoma and Texas, each game between the remaining eight programs generated over 1 million viewers with an average over 2.04 million, and 2015 Baylor-Oklahoma State generated 4.277 million in a crowded time slot. This data over seven seasons included only four non-conference matchups including Iowa, Houston and Arkansas State.
Big 12 vs. P5 Programs
To get a quick comparison we’ll look at games on network TV (ABC, CBS, Fox, NBC) and either ESPN or ESPN2. None of these networks do all that poorly and each league has a relationship with ABC/ESPN/ESPN2 at some level.
First we will look at how each league does in only league play prior to UT and OU’s departure. This allows us to see where the league has been and to see what the remaining eight will be trying to compare against.
Top: Games played on each network
Bottom: Average Viewership of games
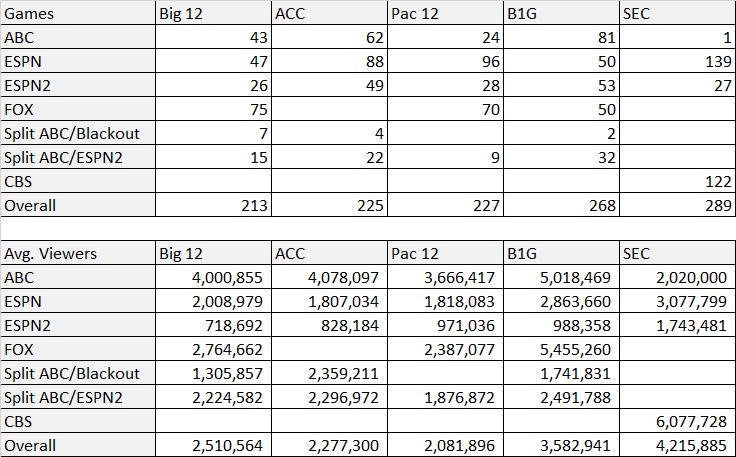
The Big 12 did better than I thought they would on these comparisons especially considering since its heaviest brand name spent half the decade losing twice in September to the likes of Maryland, Cal, BYU, and UCLA making enthusiasm for October and November games dip.
We see a clear advantage for the SEC and Big Ten which have the most blue bloods and massive flagships and land grant schools. The ACC and the Pac 12 bring up the rear.
After the loss of Texas and OU, the Big 12 obviously slides back to fifth. However, the remaining eight compare pretty evenly with the ACC and Pac 12 should those leagues lose 2-3 members representing around 20% of their best inventory.
Here’s the numbers if the following schools were taken out of the equation like UT and OU are for the Big 12. The schools omitted are Florida State, Miami, Clemson, USC, Oregon, Ohio State, Michigan, Penn State, Alabama, LSU, and Florida.
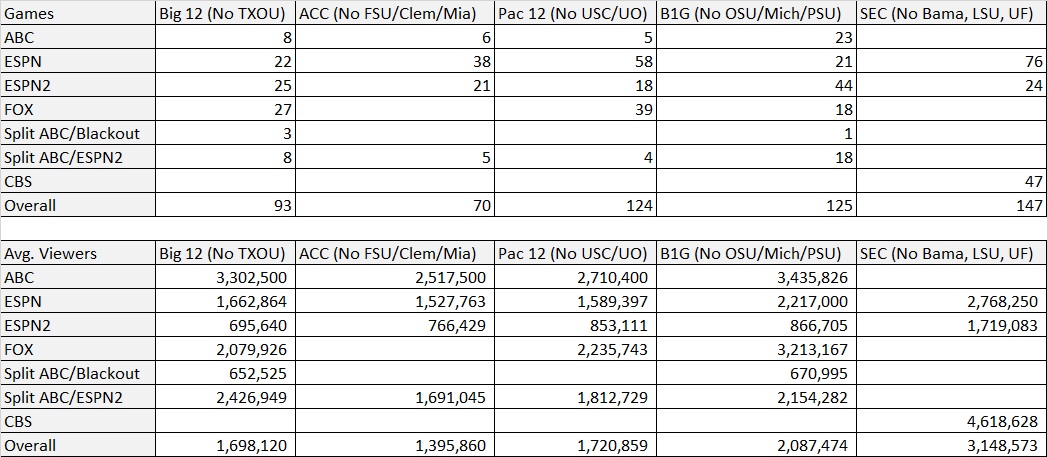
The ACC performs poorly here but I do think it’s overstated as we see how few games its remaining 11 have on ABC.
The Big Ten is decently ahead with Nebraska and Wisconsin doing the heavy lifting. The SEC, of course, blows everyone away as half to potentially over half of their members are either blue bloods or at least have an argument.
Additionally, these leagues can also shove many of their worst games onto league networks which keeps their “Kansas” teams from tanking the averages. This does illustrate how the Big Ten and SEC are clearly outpacing the other power leagues in television draw.
How did each Big 12 school stack up from 2013-2020?
When we look at league games from 2012-2020, we get the following:
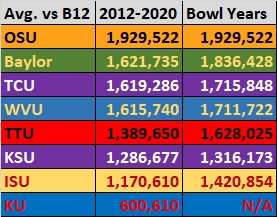
Oklahoma State ranks first for obviously reasons including never having the poor ratings associated with missing a bowl in that span and some strong teams in 2013, 2016, 2017 and 2018.
Baylor comes in second with TCU & WVU right on its heels.
Tech and KSU follow them while ISU and especially KU rank further down due to how much of the sample range was spent with losing seasons.
KU didn't make a bowl in that time and ISU made it only four of the nine years.
What does it mean for the Big 12?
It means that there will obviously be a very big cut in TV revenue as the league isn’t going to generate as many giant viewer games as it would with UT and OU still in place. With that said, the comparisons with the AAC are very much overstated.
The remaining eight Big 12 programs are pretty similar to the depth of much of the Power 5 as demonstrated above. Bowlsby put the impact at 50% of the TV value and since that comprises 62% of league revenue, it’s reasonable to expect a big drop.
What the league needs to do should no programs receive an invite elsewhere is invite the best combination of television value and competitive programs out of BYU, Army or schools from either the American Athletic Conference or the Mountain West.
We don't know where things will shake out with realignment. However, the Big 12's remaining schools should be in position to rebuild into a better league than the American is currently from a television standpoint.
