
Thank you for the in depth analysis! One small note, on the image 'ESPN before and after the 2021-2023 movements.', you list Iowa as one of the red markets ESPN is losing access to. While they no longer have Iowa, they still have access to Iowa State!
Over the last 25 years, a common message from many fans is about how absurd the travel distances for some teams in conferences can be. Why is Rutgers in with USC? Why were San Diego State and Boise State set to join the Big East at one point? There are good reasons for this and we’ll explore this in detail and give you an interactive map to play with the data yourself.
Why Is This Cross-Country Realignment Happening?
In college football, the role of television money has made — and continues to make — a massive impact on conference realignment. The rights fees and conference network profits have combined to dwarf travel costs, which now makes UCLA playing in a league with Penn State worth the crazy travel cost. It wasn’t worth it a decade ago.
It wasn’t that long ago that Larry Scott signed what was the richest TV deal for college sports paying around $21 million per school annually. Now with the Big Ten north of $60 million per school, we have long since moved past the point where travel cost is going to stand in the way of media revenue as a driving factor.
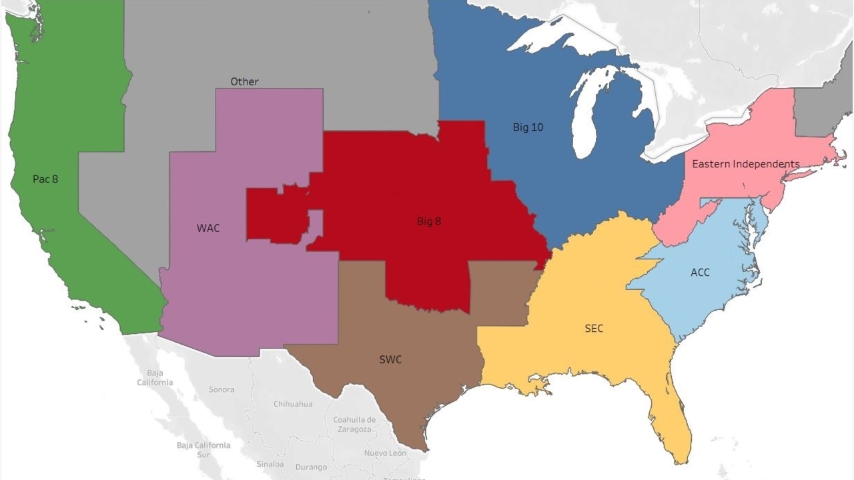
In the old days regional ticket sales drove everyone into regional conferences. It was pretty clean cut, and you could make a jigsaw puzzle of the USA with like this approximation of the 60’s, 70’s, and 80’s alignments. I didn’t pick one specific year, but generally with Georgia Tech and Tulane in the SEC, South Carolina still in the ACC, and with the Arizona schools still with Utah, BYU, Wyoming, and the rest of the old-school WAC.
SicEm365
A loose approximation of 1960’s to 1980s regional leagues.
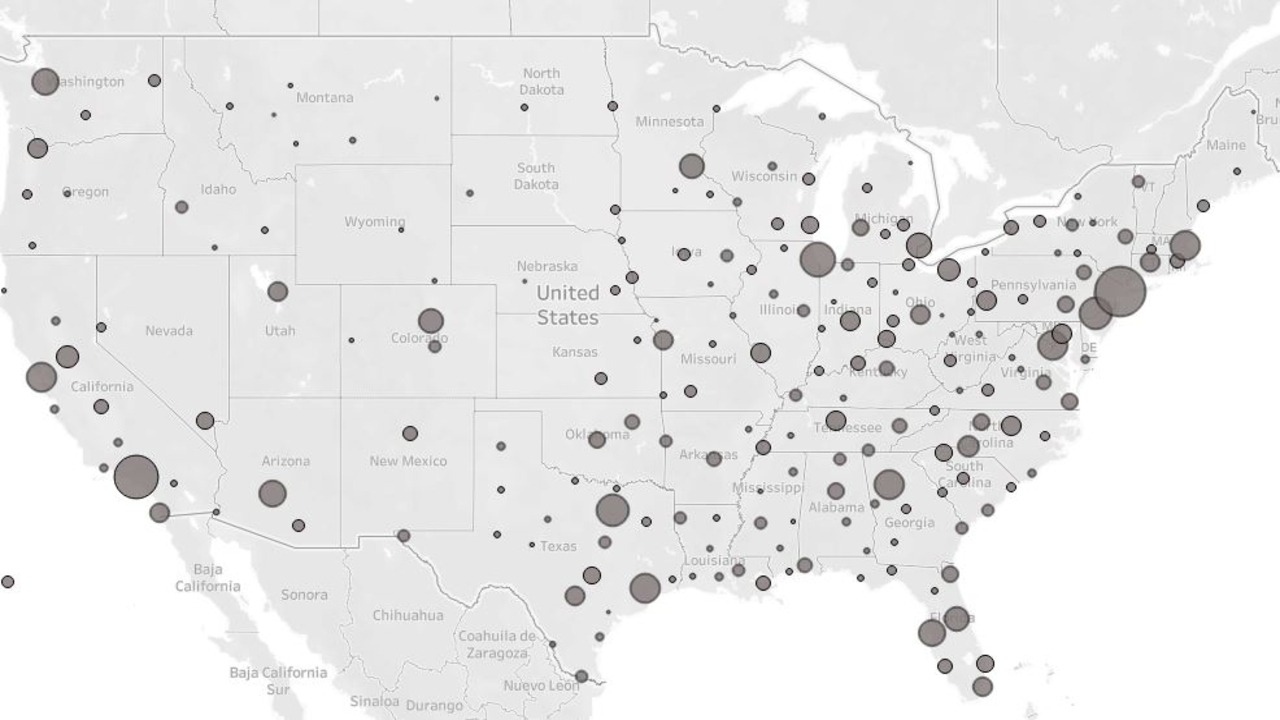
However, with the changing economic model comes the need for a new map. Instead of miles apart, the map driving the last 20 years of realignment is about TV markets, how much of those markets focus on college football, and how well leagues and cable companies could force providers to pay to include networks like BTN or SEC Network on their customer’s monthly bills. Below is a look at the relative size of the common TV markets:

SicEm365
A proportional view of how many TV homes are in each DMA.
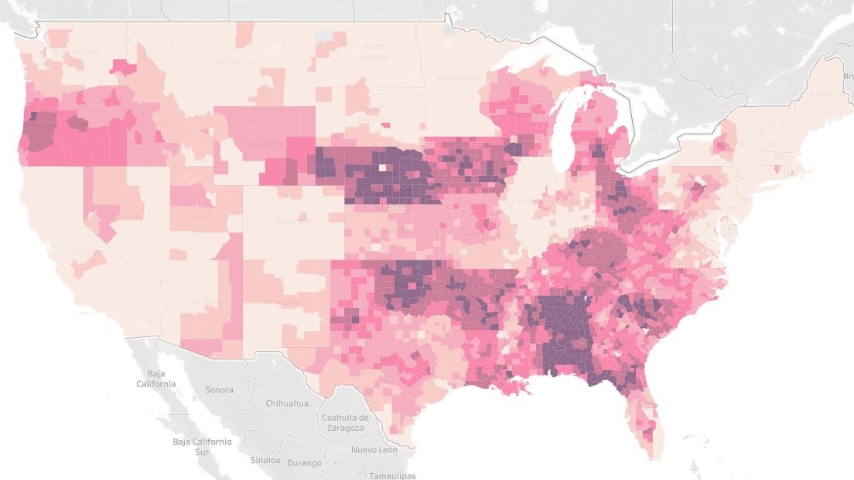
However, we generally know Tuscaloosa cares much more than Boston does per-capita but we also know Boston has a lot more TV homes so how can we estimate how much college football interest each market brings? For that, we’ll rely on an old New York Times graphic from an article that used Facebook data to approximate how much each county in the USA cared about College Football. SI also had a good commentary on it.
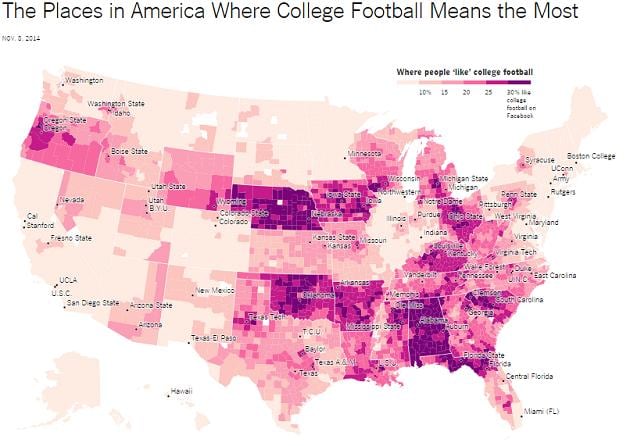
Image taken from the SI link.
I initially recreated this map with a general range for each color on their map in the interest of time. I took the midpoint of each range and the sections with less than 10% simply are adjusted to make the state-by-state totals match the NYT article’s expectations. It’s a rough cut but it’s quick enough to make it before the season and gets us the general idea. I did not subscribe to the NYT for this and didn’t have time to potentially get exact data for what percentage of people like CFB in each county but this approximation will suffice for this article. If there is demand for a revision I might revisit it later.
SicEm365
Recreating the NYT Map
Then I paired that with census population data and data linking which counties correspond to which DMA. Using the population data I can apply how much each county “likes” college football to their share of a DMA’s population. From there we can estimate how many TV households are in each county and how many of those like college football. When we roll all that back up to the DMA’s the result wildly re-ranks which markets would be critical for a College Football broadcast.
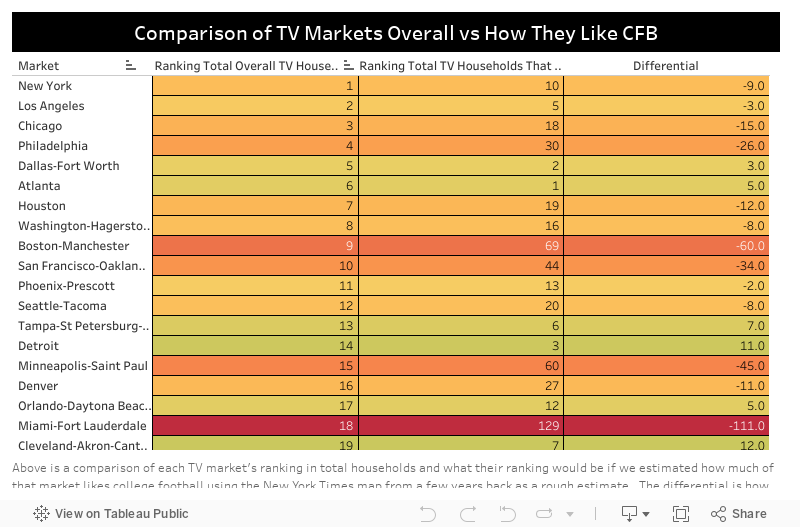
Obviously, the data isn’t perfect but it gives a clearer idea than just raw market size. Markets like Birmingham and Oklahoma City jump way up while markets like Boston, Miami, and San Francisco fall way back. Markets like Omaha and Lincoln bump up but are too small to get into the top 40. So there is a limit to what the adjustment will do and despite having only around 3% interest, the NYC DMA is still in the top ten.
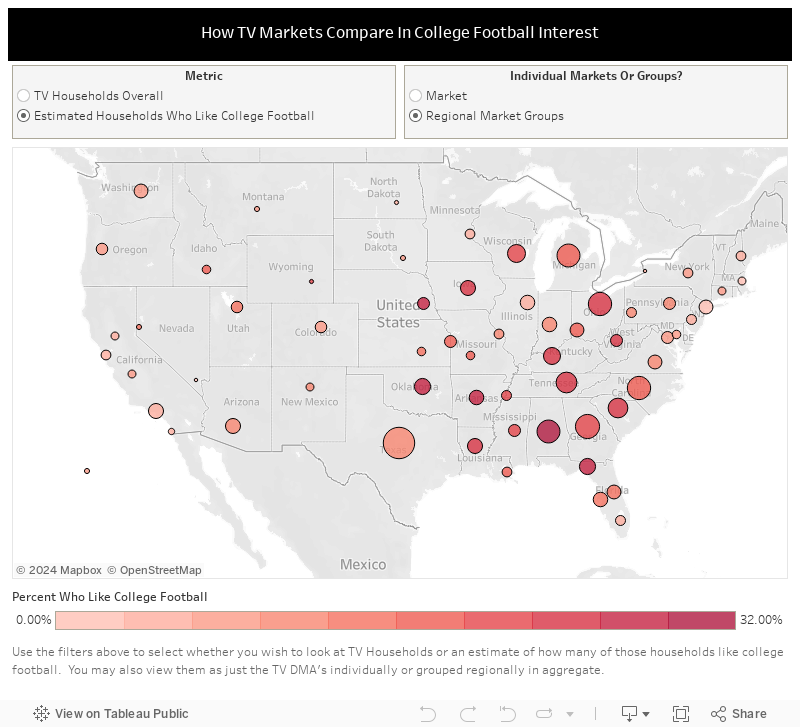
Want To Explore The Data?
The result displayed on the map is presented as a visualization you can play with as you see here. You can pick whether to look at how many TV households are in an area or how compare how many probably like college football. You can also compare individual DMA’s against a view that groups them regionally. (Note: I know Hawaii is way northwest of where they should be- that’s intentional to get them on the map without zooming further out.)
How Fox Was Able To Capture Most Of The PAC-12 and Big 12 Markets at a Discount
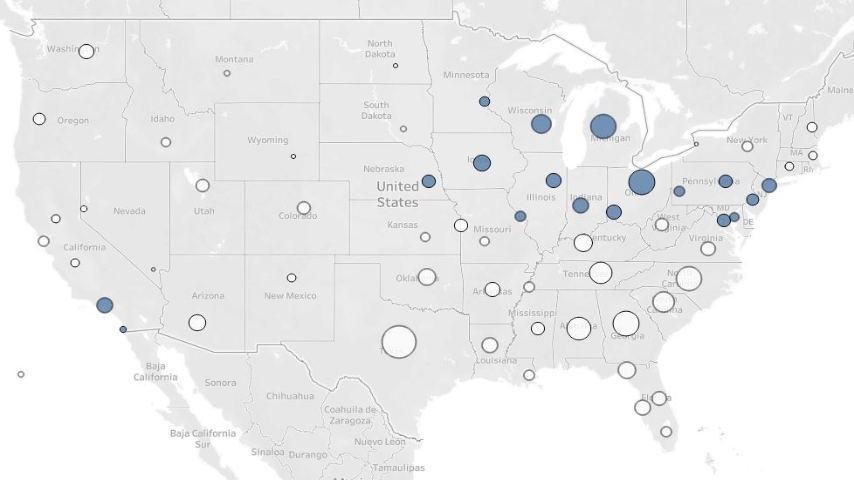
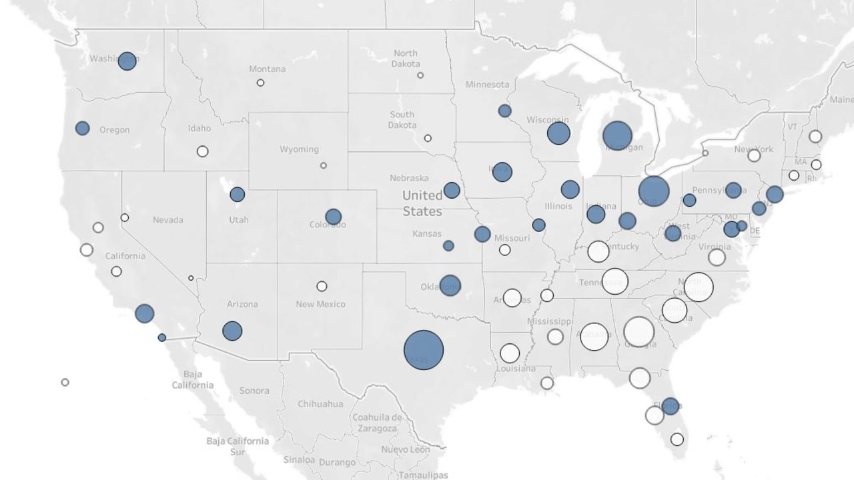
Going into late 2022 both the Big 12 and PAC-12 were coming to the table for media rights negotiations. Going into this FOX had the Big Ten as its only major CFB property past 2025 which had just added USC and UCLA giving them strong interest in the following market groups. (In this section all the screenshots will be of the clustered market groups and relative sizes based on how many CFB fans are in each market)
SicEm365
The Big Ten footprint after USC & UCLA
With both of their other main properties potentially going to the open market it meant they needed more content and the two leagues that were up for grabs offered major interest in these markets that FOX did not have a P5 presence in with their Big Ten contract.
SicEm365
Markets from the Big 12 and PAC-12 that Fox did not already have a significant drawing program in via the Big Ten.
What we see is that both leagues could get you interest in Salt Lake City’s DMA that covers the state of Utah. Both BYU and Utah do that. The Big 12 offered a massive piece with four geographically distinct schools in Texas, a school delivering solid interest in football-focused OKC and Tulsa, Kansas City, West Virginia, and the only Southeastern P5 option available to Fox with UCF in Orlando. The PAC-12 offered some big markets in Colorado, Arizona, Oregon, Washington, and the Bay Area.
With the LA schools in the Big Ten and the PAC-12 turning down $25-30M per school offers its clear that getting part of the PAC-12 would likely cost them possibly $150-300M dollars per year.
When the Big 12 extended their contract early they got $31.7M per school but Fox only pays around $11-12M of that. This made it to where if the PAC-12 couldn’t get a similarly competitive deal elsewhere there would be a way to get part of those rights at $11-12M per school by increasing their rights fees pro-rata and with fewer schools to pay. As a result of that and the late decision by the Big Ten to work with Fox to bring Oregon and Washington in for just north of $30M per year, Fox was able to grab a school in every major PAC-12 market other than Northern California for less than the $150M-300M that part or all of a PAC-12 contract would likely cost.
SicEm365
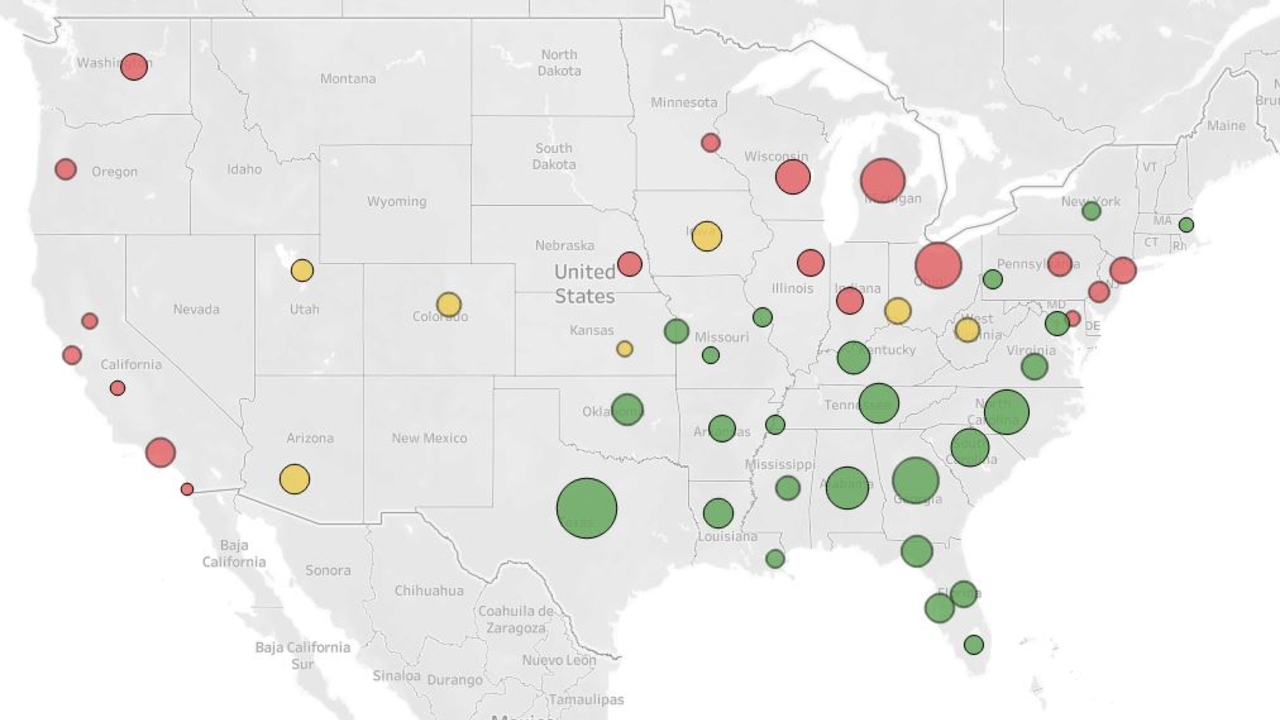
Fox’s Reach After Recent Moves
Fox was able to cover every main market other than the Bay and keep ESPN out of LA and the Northwest. Long term it would not shock me if FOX attempted to get more content in the south.
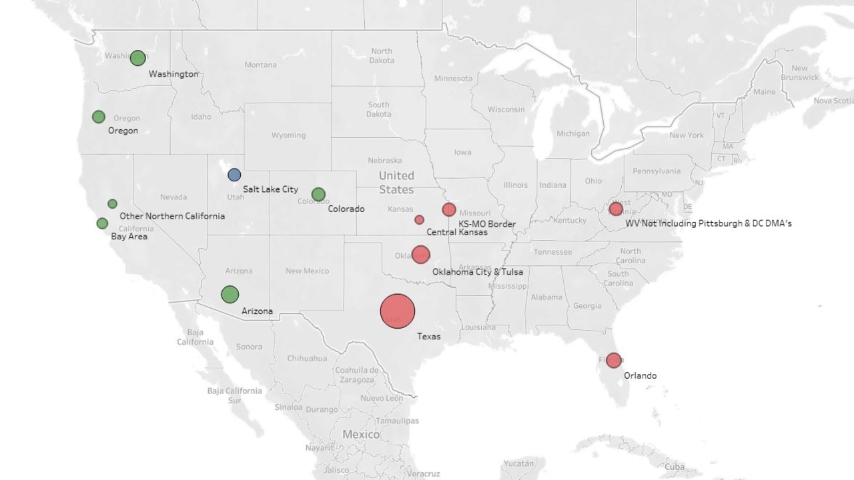
How Did ESPN get impacted this round?
ESPN grabbed arguably the most valuable weekly property with the SEC’s game of the week they outbid CBS for. Geographically they got more regional losing properties across the prior Big Ten, California, and the Northwest. In red you see the future Big Ten markets that ESPN doesn’t have a reasonable competitor for interest in. In green you see the markets where they have a P5 team under contract through 2030. In yellow it;s the Big 12 markets that don’t overlap with the SEC or ACC they share with FOX.
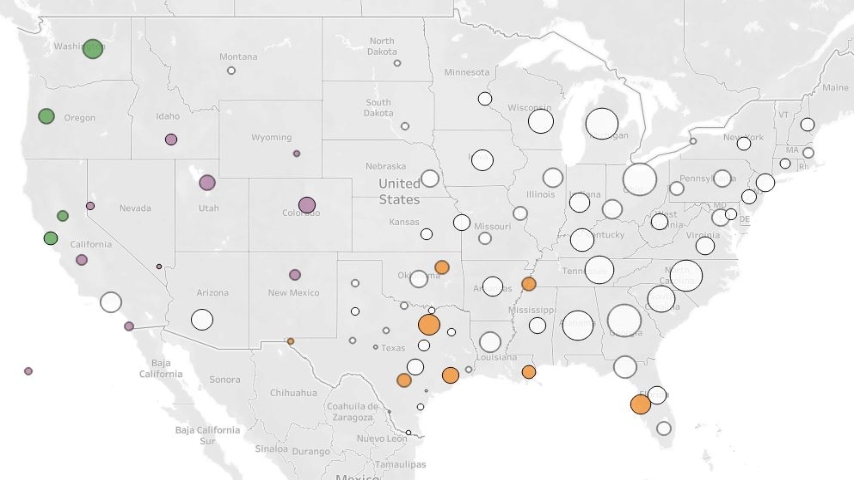
Now both ESPN and Fox could get into some western markets by doing a deal with the Mountain West when they negotiate or by doing a deal with the “PAC-4” schools or shuffling them to a league where they have an existing contract. Below you see the “PAC-4” markets in green, the MWC markets that don’t overlap with them in purple, and some other (very lightly) rumored expansion options further east in orange. Obviously, the degree to which a given school “delivers” a market is up for debate depending on the school.
SicEm365
PAC-4, MWC, and other possible market additions.
What’s Next?
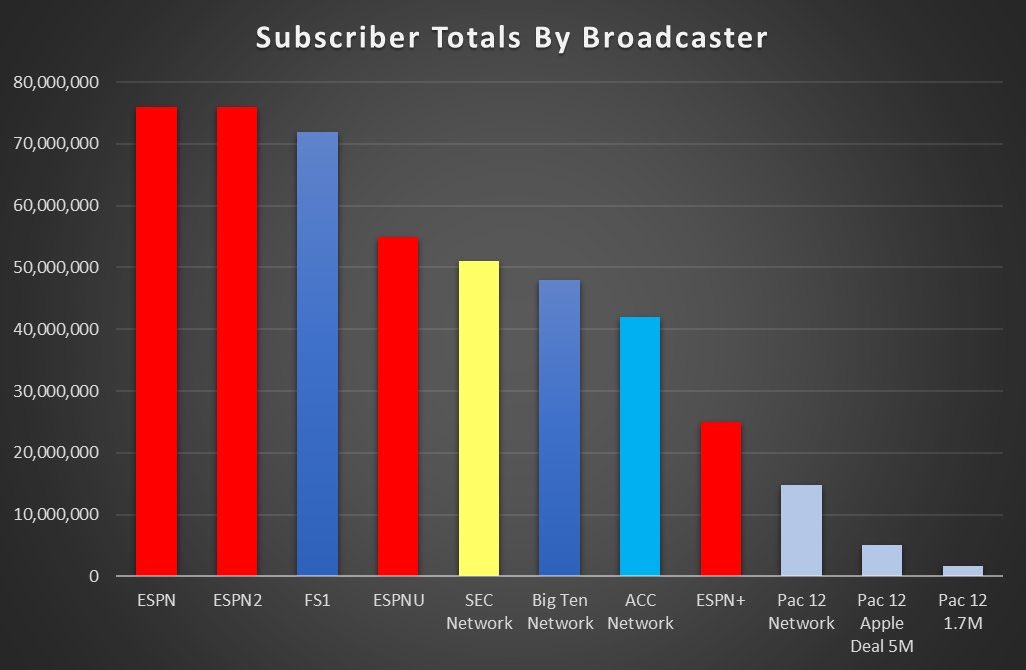
Streaming is the future- but it’s not matured into that yet for CFB. The most used college sports streaming service (ESPN+) has only 25M subscribers compared to much more in basically any of the linear channels fans usually tune into. This comes brutally into focus when you compare the optimistic subscriber targets for the PAC-12 TV deal with Apple to what other networks reach currently.
Long-term subscriber growth on the streaming side paired with cord-cutting will bring that closer and as that happens your potential subscriber base as a program will matter more than if you happen to be in a big market.
The next pieces of the puzzle will become set once we know whether the PAC-4 have any options with any other P4 league and how that impacts whether they can rebuild the PAC-12 or if they get added to the MWC or AAC.
The dominoes that fall will be interesting to watch.
Follow @Baylor_S11 on Twitter!