How Colorado Matchups Up with Baylor By the Numbers
This is part two of my Baylor-Colorado preview covering their stats. Part one covered their roster and the rest of the series will cover their scheme.
Year Two Of The Most Hyped Rebuild Of All Time Showing Progress
Colorado’s team has been a national headline since Deion was hired to take over a program that was among the nation’s worst in 2022. He’s upgraded them significantly but just how good are they? We dive into the numbers below.
Below, we have a combination of charts and tables to help us understand the resume. The tables have Colorado against their opponents compared to other P5 teams against those same opponents with a third column showing 2023’s results. The charts will have a given metric with Colorado in gold and either the opponent in the opponent’s colors or other teams against their schedule in gray. The backgrounds will be shaded green, yellow or red, respectively, to indicate whether a metric is performing well, average, or poor.
Offense
The offense has been the headliner for this group going back to the 2023 opener where they took TCU down in a shootout. Then-OC Sean Lewis got a lot of publicity off of it and then was demoted in favor of former NFL coach Pat Shurmur. I have colored the bars below differently to show what portions of 2023 refer to which OC.
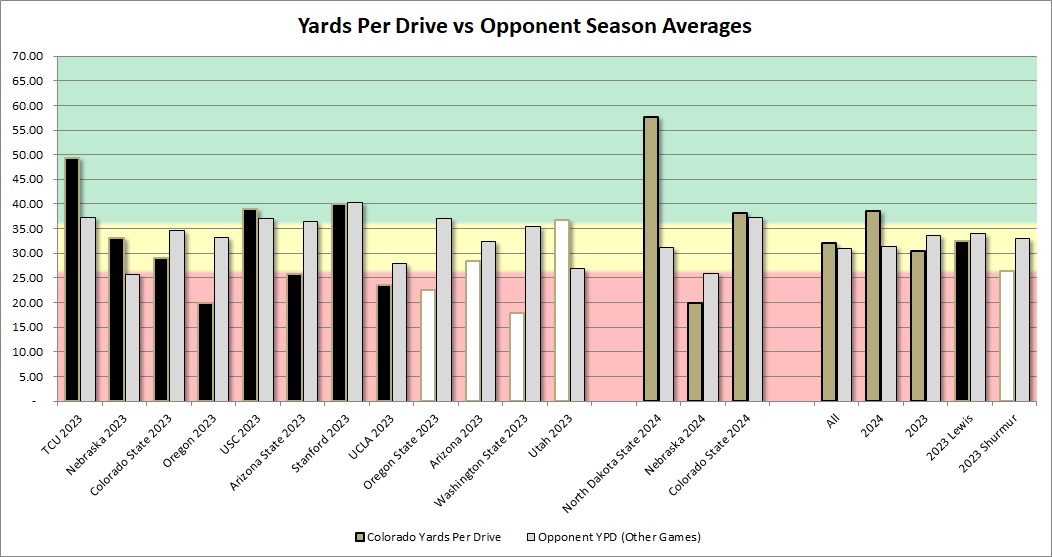
Under both guys, Colorado was very up and down on offense but overall averaged below what opponents give up per drive. This year they have been better early on with an obliteration of NDSU’s solid FCS defense and a solid outing against a bad CSU defense mixed with a mismatch against Nebraska’s defense.
Offensive Overview Stats
Offensively this is a solid upside squad. They have high yards per drive, high yards per play, and solid third downs. However, they struggle in the red zone.
| Colorado 2024 | Other Teams vs 2024 Opponents | 2023 Season | |
| Yd Drive | 38.59 | 31.47 | 30.47 |
| Points Per Red Zone Trip | 4.56 | 6 | 5.87 |
| Turnovers Per Game | 1.33 | 1.33 | 0.92 |
| Yards Per Play | 6.33 | 5.32 | 5.24 |
| Total Yards | 394.33 | 322 | 363.58 |
| % Of Drives Scored | 33.33% | 31.67% | 38.46% |
| % Turnover Drives | 12.12% | 13.33% | 7.69% |
| 3rd Down % | 44.44% | 36.84% | 39.08% |
| 3rd or 4th Down % | 47.22% | 46.05% | 44.83% |
They are also solid at extending drives on third down.
Offensive Passing Game
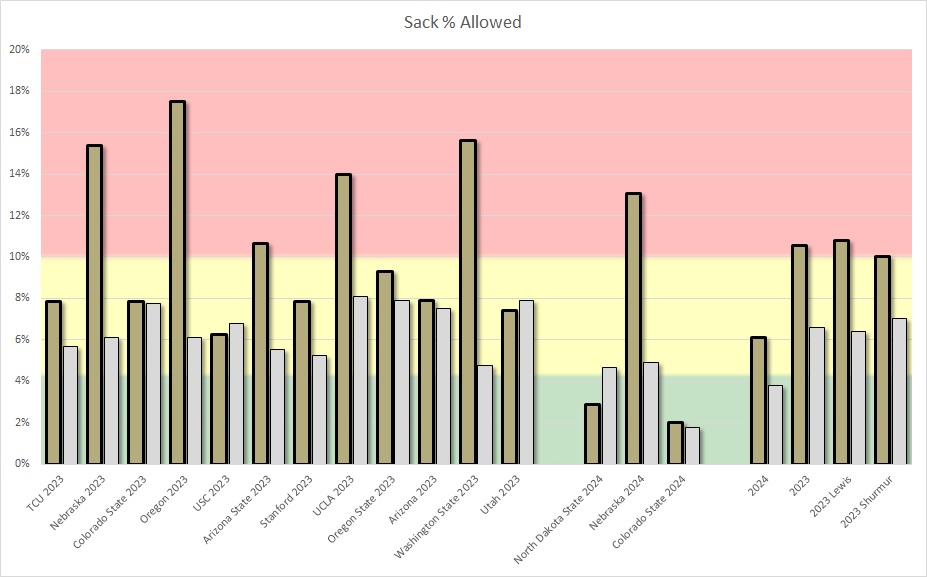
The passing game is their strength. They complete a very high percentage of passes with a high yards per attempt and low percentage of interceptions. However, sacks have been an issue and when that is applied their yards per pass attempt does come down some.
| Colorado 2024 | Other Teams vs 2024 Opponents | 2023 Season | |
| Completion Percentage | 69.11% | 59.35% | 68.14% |
| Yards/Att | 8.12 | 7.08 | 7.46 |
| Yards/Completion | 11.75 | 11.93 | 10.95 |
| Yards/Pass Including Sacks | 7.24 | 6.66 | 5.74 |
| Sack % | 6.11% | 3.73% | 10.57% |
| INT % | 1.53% | 3.11% | 0.75% |
Here we see that sack impact visualized. The combined stacked bars are the raw yards per pass attempt. The sack-adjusted numbers are just the gold bars and the yards per attempt lost to sacks is in transparent gray. The summary columns on the right show just how much it impacts them.
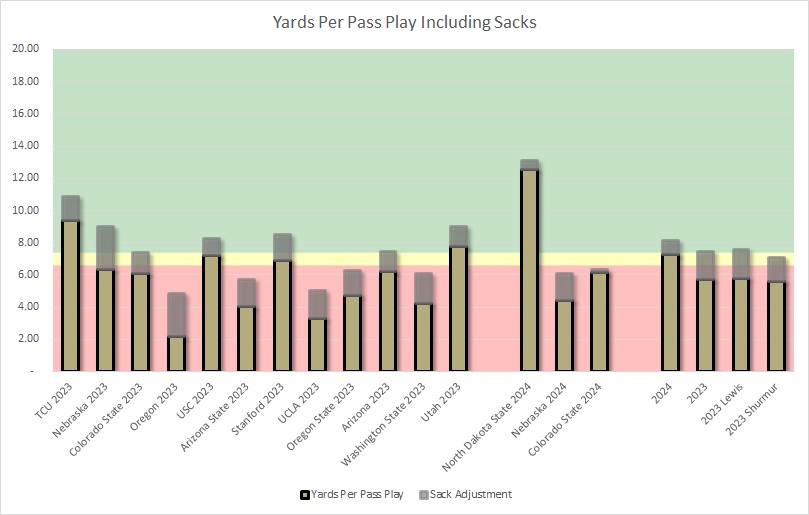
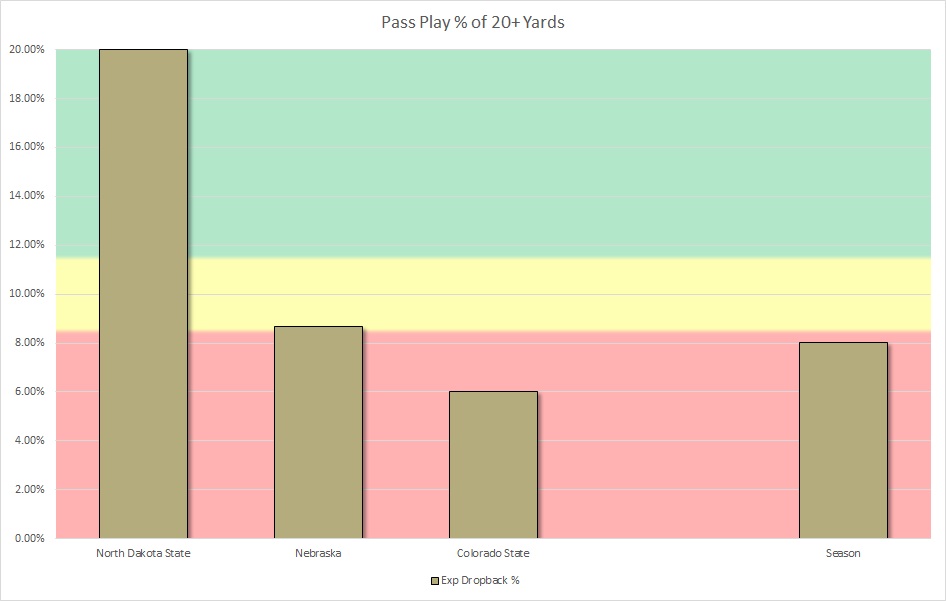
This passing attack is potentially very explosive though and lit up NDSU before Nebraska and Colorado State limited the big passing plays significantly.
Part of the issue has been protection. It’s not as pronounced as 2023. Part of the reason for the OC switch in 2023 was pressure on Shedeur Sanders and it din’t really yield immediate benefit. This year they’ve done better against their FCS and MWC opponents but Nebraska destroyed their protections.
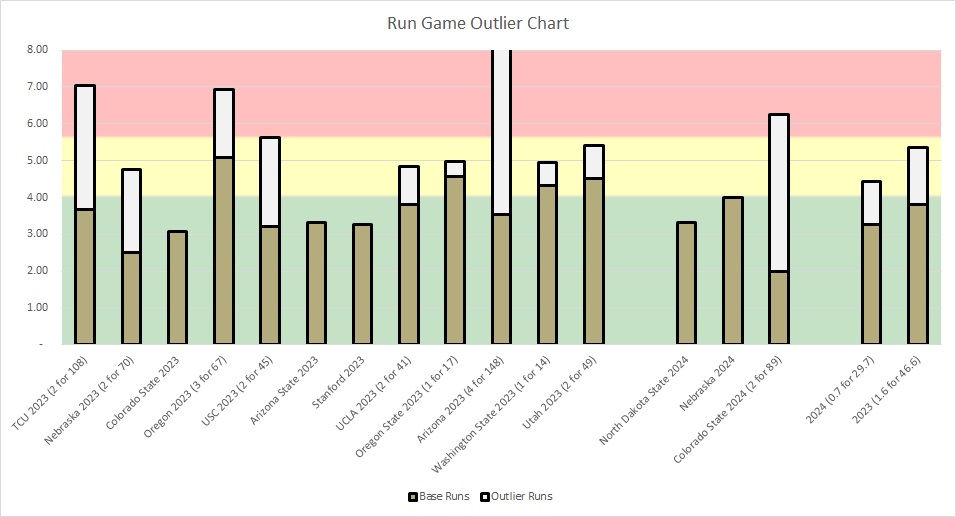
Offensive Run Game
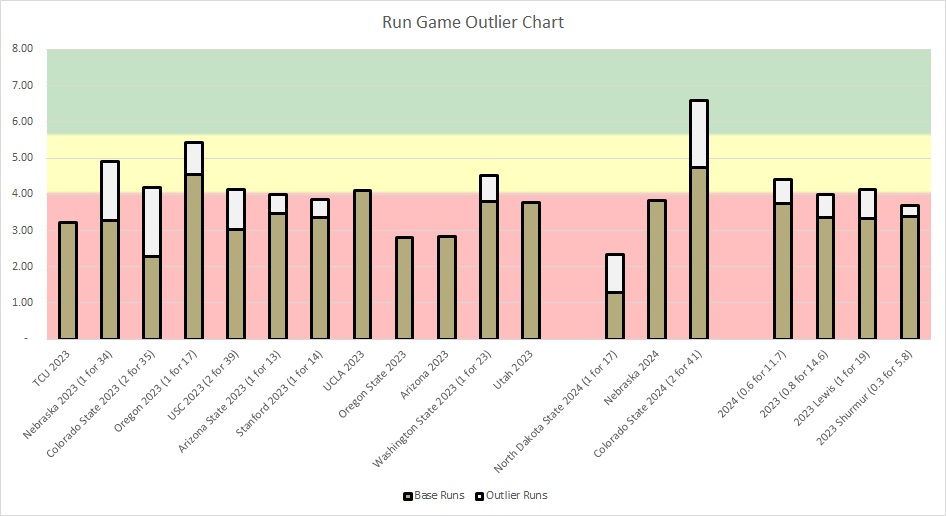
This team has struggled to run it consistently. Each of these figures is very low explaining why Colorado has only 30-40% runs against opponents who usually see 55%.
| Colorado 2024 | Other Teams vs 2024 Opponents | 2023 Season | |
| Yards/Rush | 2.88 | 4.01 | 2.31 |
| Yards/Non-Sack Carry | 4.18 | 4.26 | 4.37 |
| QB Non-Sack YPC | 3.45 | 4.54 | 5.59 |
| Non-QB YPC | 4.36 | 4.38 | 4.08 |
| Run Play % | 29.95% | 55.65% | 36.3% |
Over the past year the only times we’ve seen them run it well were last week against Colorado State or the fourth quarter of Oregon’s blowout win last year. Below you see their tailback yards per carry as the full stacked bar, the contribution to their yards per carry of outlier runs of usually 16-20+ yards in white, and the rest of their per-carry average in gold.
Defense
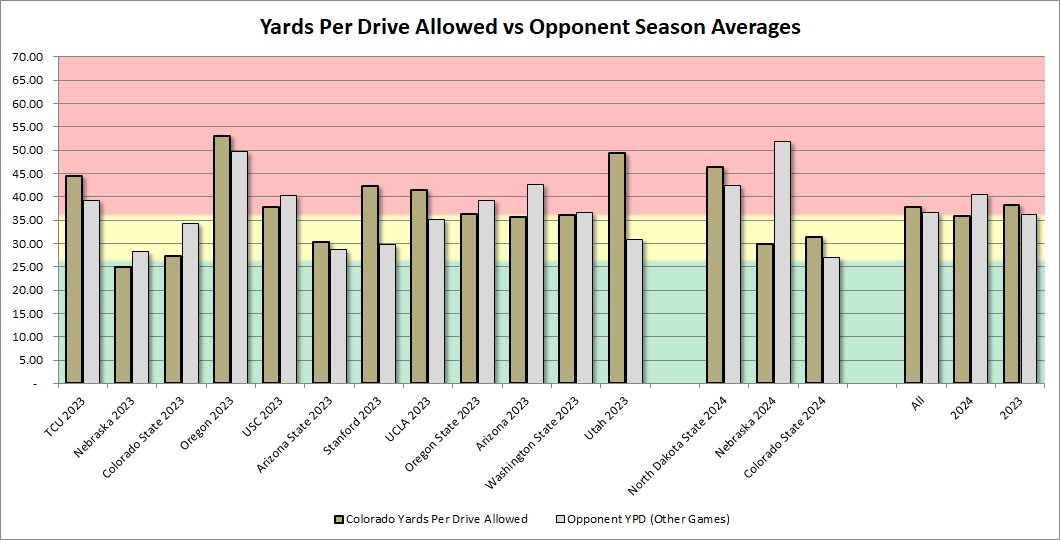
Defensively the Buffaloes have been struggling for the most part since Deion arrived. Other than Nebraska and Colorado State last year it’s been rough through 2023 and during the first game of 2024. Time will tell how good Nebraska and CSU’s offensive production is once the schedule is more of a representative sample. With that said Colorado is holding Nebraska well below what UTEP and Northern Iowa did and held Colorado State a little worse than the combined figure Texas and Northern Arizona did.
Defensive Overview Stats
This defense is allowing a similar yardage per drive to last year but is doing better on yards per play. points per red zone trip, third down percentage, and scoring drive percentage. It’s showing improvement under a new DC and a new scheme.
| Colorado 2024 | Other Teams vs 2024 Opponents | 2023 Season | |
| Yards Per Drive | 35.88 | 40.41 | 38.31 |
| Points Per Red Zone Trip | 4.14 | 5.36 | 4.93 |
| Turnovers Per Game | 1.33 | 1 | 1.67 |
| Yards Per Play | 5.5 | 6.24 | 6.27 |
| Total Yards | 374.33 | 410.83 | 453.33 |
| % of Drives Scored | 33.33% | 49.21% | 43.36% |
| % Turnover Drives | 13.33% | 9.52% | 13.99% |
| 3rd Down % | 32.5% | 53.16% | 46.67% |
| 3rd or 4th Down % | 47.5% | 58.23% | 52.73% |
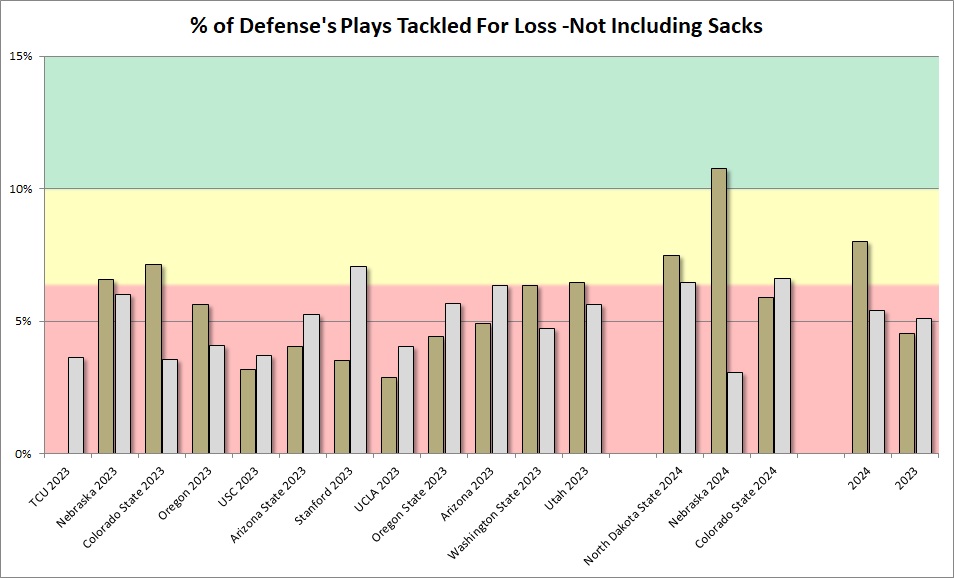
One of the areas they’ve improved is tackles for loss. They are doing much better at inflicting negative plays. They were able to do a good job of it against Nebraska.
Defensive Passing Game
In the air, they are struggling to stop completions but allow very few yards per completion. Nebraska and NDSU lit them up for 76% completions while Colorado State largely struggled with 56%.
| Colorado 2024 | Other Teams vs 2024 Opponents | 2023 Season | |
| Completion % | 68.42% | 67.06% | 64.51% |
| Yards/Att | 7.22 | 7.65 | 7.97 |
| Yards/Completion | 10.55 | 11.41 | 12.35 |
| Yards Pass Play Including Sacks | 6.72 | 7.27 | 7.17 |
| Sack % | 4.04% | 2.86% | 6.08% |
| INT % | 2.02% | 2.29% | 2.25% |
They did ok in sack percentage against NDSU and Colorado State but got no traction on this stat against the Huskers.
Defensive Run Game
The Buffaloes have been better limiting the run this year with better per carry stats.
| Colorado 2024 | Other Teams vs 2024 Opponents | 2023 Season | |
| Yards/Rush | 4.01 | 5.17 | 4.69 |
| QB Non-Sack YPC | 4.43 | 6.58 | 6.54 |
| Non-QB YPC | 4.4 | 5.3 | 5.29 |
| Run Play % | 51.47% | 55.7% | 48.85% |
The improvement is better highlighted in the outlier chart. Outside of two Colorado State runs they really have held running games better.
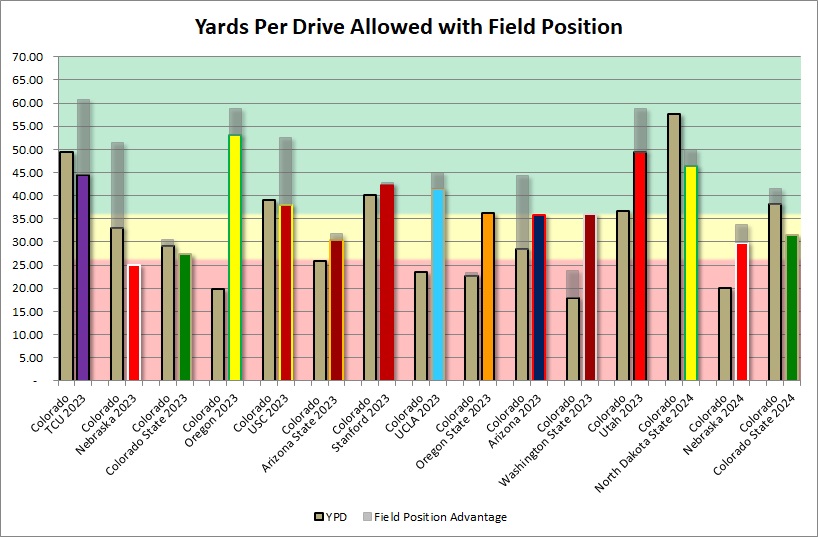
Special Teams & Field Position
In the kicking game, they’ve been productive returning kickoffs so Baylor’s consistent ability to generate touchbacks could be a boost for the Bears. As for their coverage units they’ve been solid which is good since their touchback percentage is pretty low. Colorado is averaging a slight field position disadvantage.
| Colorado 2024 | Other Teams vs 2024 Opponents | 2023 Season | |
| Kick Return Average | 33 | 13.25 | 21.79 |
| Punt Return Average | 3.75 | 10.67 | 10.35 |
| Opponent Kick Return Avg. | 18 | 28.88 | 23.88 |
| Opponent Punt Return Average | 8.75 | 18.9 | 7.56 |
| Average Field Position | 74.21 | 73.6 | 70.41 |
| Opponent Average Field Position | 72.87 | 67.92 | 69.66 |
| Touchback Kickoff % | 23.08% | 26.92% | 41.67% |
| Opponent Touchback Kickoff % | 71.43% | 54.05% | 74.65% |
When we overlay the advantage in average starting field position advantage on top of yards per drive for the team that benefited from it we can see how it impacted several 2023 games but hasn’t been a huge 2024 factor.
Key Takeaways
- This offense has tons of speed, a high-level QB, and a line that doesn’t match. It reminds me of some of the Colt McCoy Longhorn teams in that regard. They can absolutely shred you in the air if given the chance but the run doesn’t truly scare you.
- They have improved defensively so far. This will be another good barometer for Baylor’s revamped offense after beating up on a traditionally effective but athletically limited AFA squad last week.
- It’s remarkable how much more dangerous Colorado is now than in 2022. Sanders gets criticism given the hype around the program but it’s easy to forget this is a rebuild in year two.
Up next we will analyze how Colorado schematically attacks and how BU can counter.
Follow @Baylor_S11 on X!