This is part two of my Baylor vs. LSU preview covering the LSU Tigers’ statistical performance. Part one covered the roster and the later part of the series will cover their X’s and O’s schemes.
LSU’s Offense Is Still Explosive But Their Defense Is Improved
How good is LSU in different phases of the game? With drive counts, styles of play, and other factors making things tougher to read we can take a closer look at a few numbers to see exactly where the strengths and weaknesses lie.
Below is a combination of charts and tables to help us understand the resume so far. The tables have LSU against their Power 4 opponents compared to other P4 teams against those same opponents. For comparison, I have compared this to last year’s metrics for them. The charts will have a given metric with LSU in yellow and purple with either the opponent in the opponent's colors or other P4 teams against their schedule in gray. The backgrounds will be shaded green, yellow or red, respectively, to indicate whether a metric is performing well, average or poor.
Offense

This offense is very productive in yards per drive. They blew the doors off of Vandy, UCLA, and South Alabama while also having some very productive days against USC, Arkansas, Bama, UF, and OU. Baylor isn’t holding teams down yardage-wise very well so it will be a big test for the Bears.
Offensive Overview Stats
This is a long way from what LSU was under Les Miles- this offense is dynamic. They average around 40 yards per drive, score on nearly half of their drives, and are an absolute pain to get off the field on third and fourth downs. They struggle in the red zone and are merely decent in turnovers though. It’s nowhere near as dominant as the 2023 offense was but they are still very good.
| LSU vs P4 | Other P4 vs Opponents | 2023 vs P5 | |
| Yd Drive | 40.01 | 33.42 | 50.05 |
| Points Per Red Zone Trip | 4.26 | 4.68 | 5.49 |
| Turnovers Per Game | 1.3 | 1.61 | 0.8 |
| Yards Per Play | 5.76 | 5.47 | 8.19 |
| Total Yards | 413.4 | 367.83 | 529.1 |
| % Of Drives Scored | 47.17% | 34.79% | 59.62% |
| % Turnover Drives | 12.26% | 14.55% | 7.69% |
| 3rd Down % | 48.72% | 38.19% | 49.49% |
| 3rd or 4th Down % | 55.13% | 46.03% | 52.53% |
Here is a chart showing the yellow bars as their third-down conversion rates. The light bars are stacked on top. That’s the added percentage they eventually converted on fourth down. So, of their third down chances, what did they convert on the next two downs? They have been at least decent on converting these scenarios in every game while UCLA, South Alabama, and Vandy were dominant. They allow pretty low tackles for loss which contributes to this at only 3.84% of their plays having a non-sack TFL.

Offensive Passing Game
They are slightly better than their schedule throwing the ball when you look at completions, interception rate, sack rate, and sack-adjusted yards per attempt. Nussmeier is a very good QB and while he’s not matching the gaudy numbers that Jayden Daniels put up with a better supporting cast he has been great for them. They do a lot of five-man protections where the QB has to get the ball out quick and he is a big factor in that low sack rate.
| LSU vs P4 | Other P4 vs Opponents | 2023 vs P5 | |
| Completion Percentage | 62.62% | 61.95% | 68.44% |
| Yards/Att | 7.24 | 7.6 | 10.33 |
| Yards/Completion | 11.56 | 12.26 | 15.09 |
| Yards/Pass Including Sacks | 6.7 | 6.51 | 9.46 |
| Sack % | 3.45% | 7.78% | 5.88% |
| INT % | 2.07% | 2.82% | 1.47% |
They are explosive in the air. Not every week but usually they are hitting a sizeable percentage of passes for 20+ yards. USC, Arkansas, Alabama, Florida, and OU slowed them some but 81% of their 20+ plays come in the air. Limit that and make them earn points in the red zone.

They do a great job either in protection or in getting rid of the ball quickly as only one team has sacked them at a decent rate: Florida. What’s notable about Florida? Some former Baylor DC & Aranda protege named Ron Roberts. It’s not crazy to assume some tactics might be similar to how Aranda will go after them.

Offensive Run Game
On the ground, the Tigers are not all that strong and pretty similar to what other teams do to their opponents. It’s a far cry from what they did last year when legit dual threat Jayden Daniels forced defenses to account for the QB and ran for 1,000 himself. LSU is a team whose rushing metrics line up with their schedule’s typical allowance but they run it a ton less at less than 40% of the time. As I said before, there’s a dramatic difference from the Miles days and the Coach O days. It also explains the red zone issues to some degree.
| LSU vs P4 | Other P4 vs Opponents | 2023 vs P5 | |
| Yards/Rush | 3.67 | 3.68 | 6.09 |
| Yards/Non-Sack Carry | 4.31 | 4.45 | 6.77 |
| QB Non-Sack YPC | 4.43 | 5.02 | 11.47 |
| Non-QB YPC | 4.45 | 4.43 | 4.87 |
| Run Play % | 39.42% | 50.27% | 47.37% |
Below is an outlier chart where the combined stacked bars vertically equal the offense’s non-sack yardage per carry from the RB position. The stacked white bars show how a small number of “outlier runs” of around 16-20 yards or more contribute to the tailback yards per carry average.
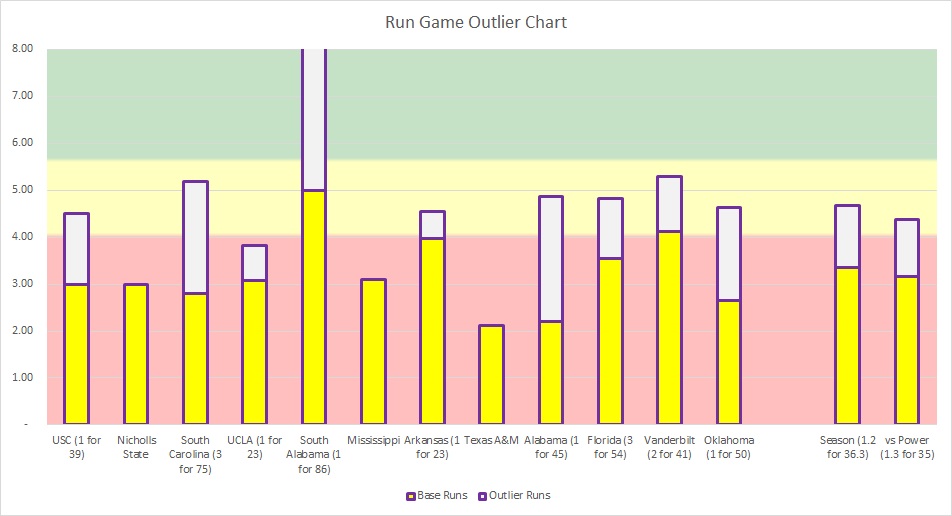
What we see is this group usually isn’t rattling off consistent chunks on the ground. Usually, it’s 1 long run and a bunch of smaller carries. This is very different than some of the teams Baylor played this year.
Defense
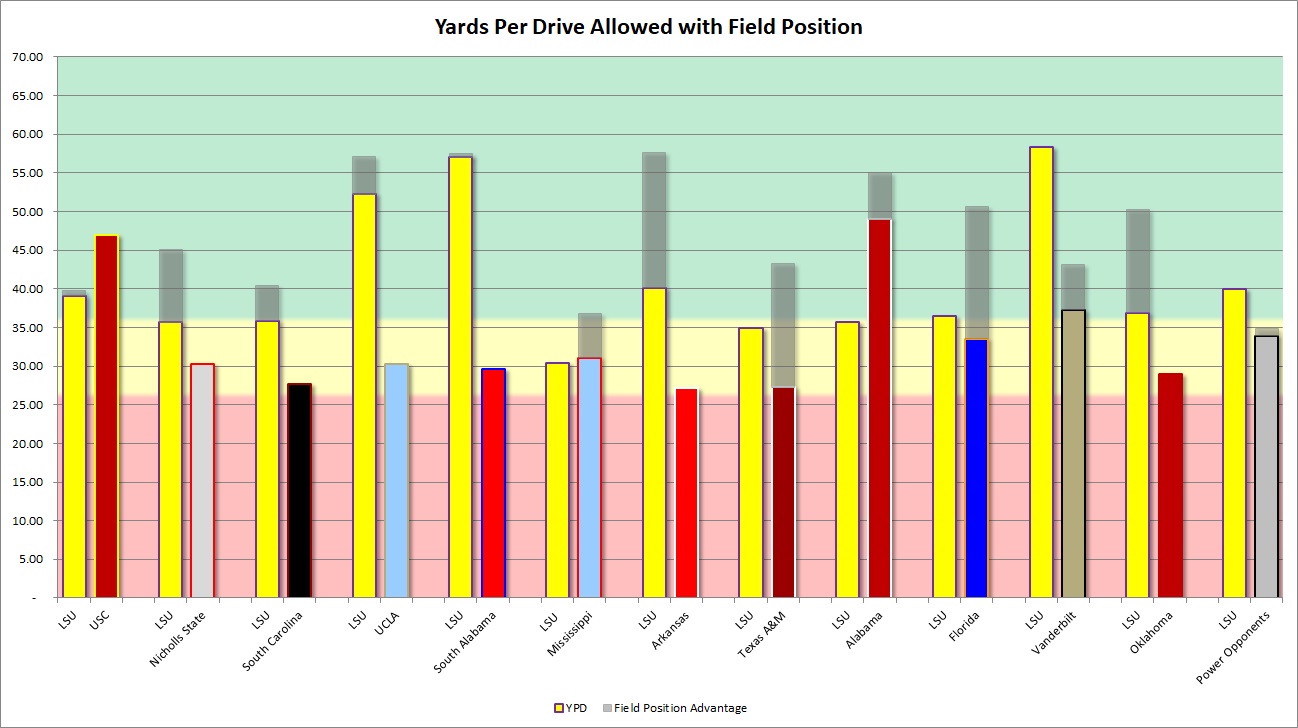
Defensively they’ve been up and down after being mostly down in 2023. The Alabama Crimson Tide, Vanderbilt Commodores, Florida Gators, and USC Trojans all got high yards per drive on them but they did a good job limiting the rest. Statistically, Baylor is one of the better offenses they’ll see so the Tiger defense faces a challenge similar to how Baylor’s will.
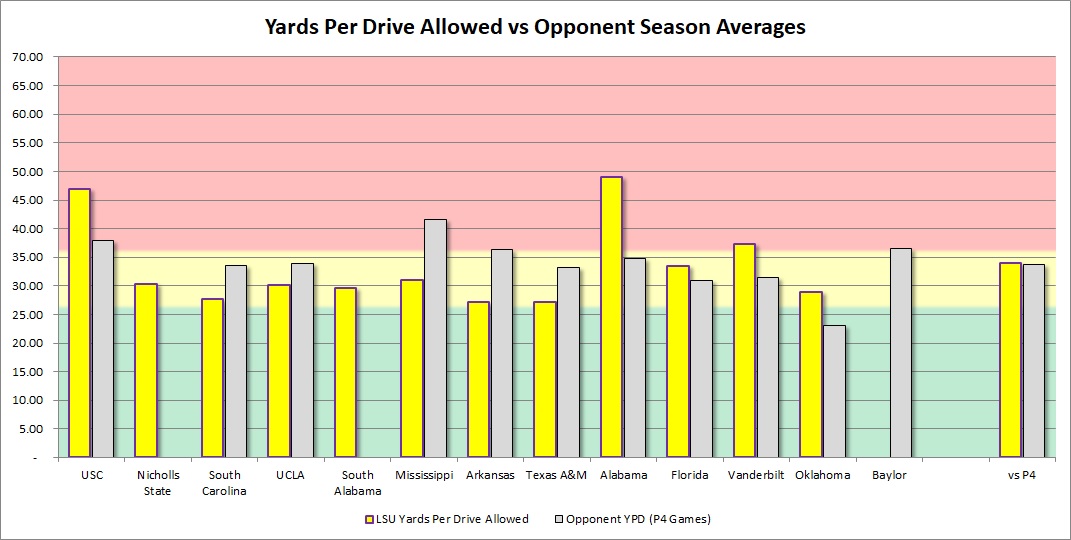
Defensive Overview Stats
Defensively LSU is pretty similar to what their opposition gives up. They allow just more yardage than their schedule generates, slightly more scoring drives, slightly worse turnover drive percentages, and slightly worse 3rd down conversions. They do however do slightly better in the red zone. However this is indicative of MASSIVE improvement under new DC Blake Baker as 2023 was an absolute disaster with 40+ yards per drive allowed, 49% scoring drives, 47.5% on third downs, 56% on either third or fourth, and very few turnovers.
| LSU vs P4 | Other P4 vs Opponents | 2023 vs P5 | |
| Yards Per Drive | 33.91 | 33.82 | 40.39 |
| Points Per Red Zone Trip | 4.87 | 4.97 | 5.8 |
| Turnovers Per Game | 1.2 | 1.51 | 0.8 |
| Yards Per Play | 6.02 | 5.71 | 6.49 |
| Total Yards | 360.2 | 376.47 | 454.2 |
| % of Drives Scored | 42.31% | 37.83% | 49.09% |
| % Turnover Drives | 11.54% | 13.59% | 7.27% |
| 3rd Down % | 42.15% | 40.21% | 47.48% |
| 3rd or 4th Down % | 46.28% | 46.25% | 56.12% |
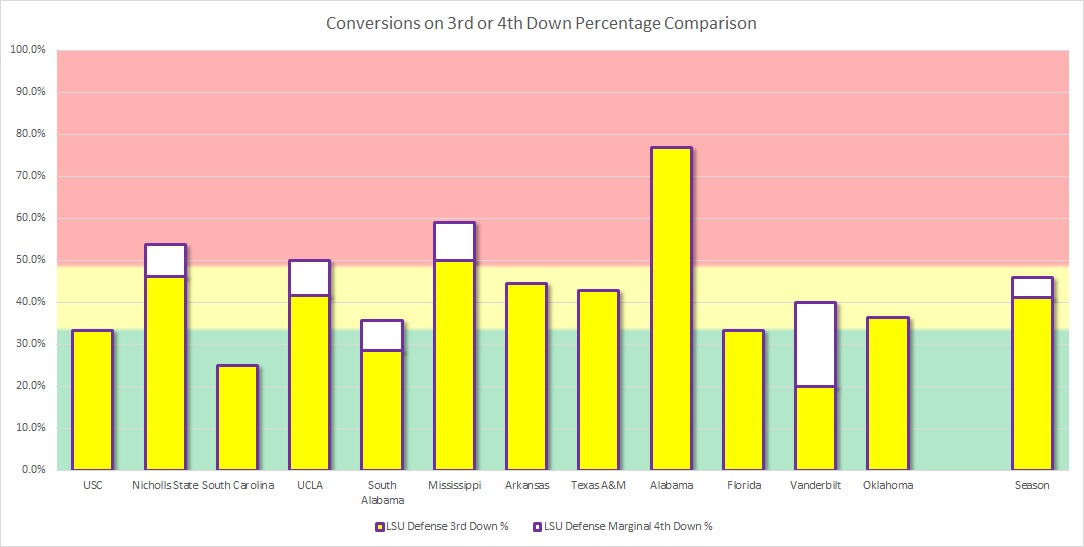
They disrupt decently which helps them be up and down on 3rd and 4th down conversions. Alabama, Ole Miss, and UCLA stayed on the field well but everyone else of their FBS opponents was pretty average to poor against the Tigers in this metric.
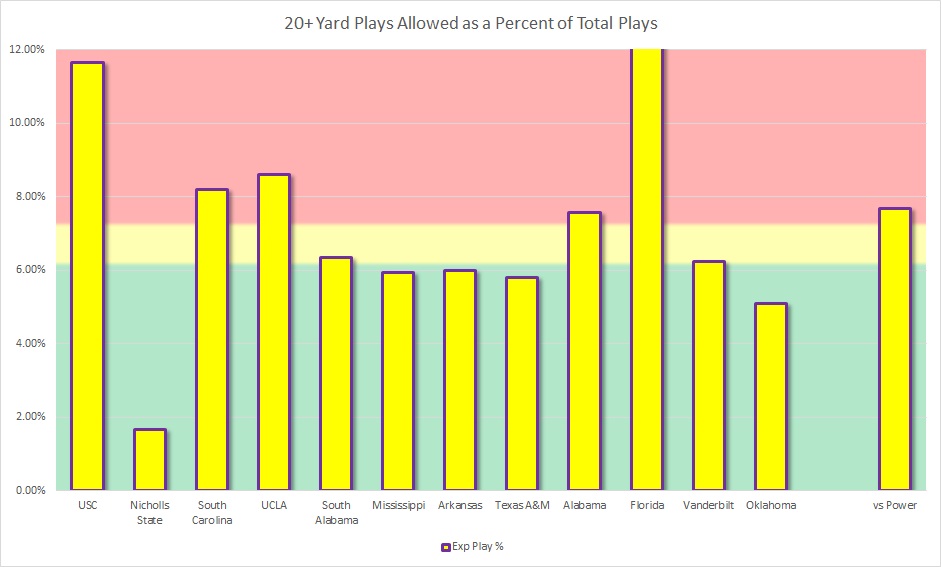
Part of the high yards per play is due to 20+ yard explosive plays. They gave up a lot of them and USC, South Carolina, UCLA, Alabama, and Florida gave them trouble. They limited OU, Vandy, and Ole Miss pretty well.
Defensive Passing Game
LSU is aggressive schematically to disrupt teams and it comes through here. They generate a lot of sacks and lower-than-expected completions but give up slightly more yards per completion when they don’t disrupt teams. The improvement from 2023 is significant in all areas except interception rate.
| LSU vs P4 | Other P4 vs Opponents | 2023 vs P5 | |
| Completion % | 59.78% | 63.12% | 64.81% |
| Yards/Att | 7.62 | 7.82 | 8.54 |
| Yards/Completion | 12.75 | 12.39 | 13.17 |
| Yards Pass Play Including Sacks | 6.25 | 6.76 | 7.45 |
| Sack % | 9.8% | 7.33% | 7.34% |
| INT % | 1.63% | 2.62% | 1.63% |
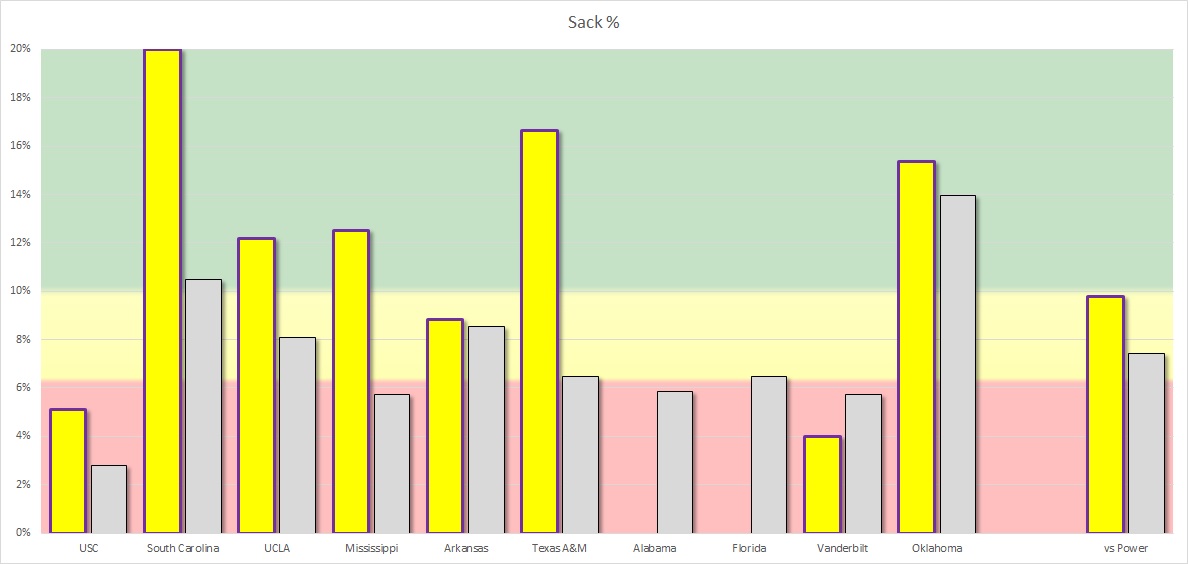
They get after the QB well. South Carolina, UCLA, Ole Miss, OU, and A&M all gave up a high rate of sacks to the Tigers. However, Alabama, Florida, and USC held them off decently well.
Defensive Run Game
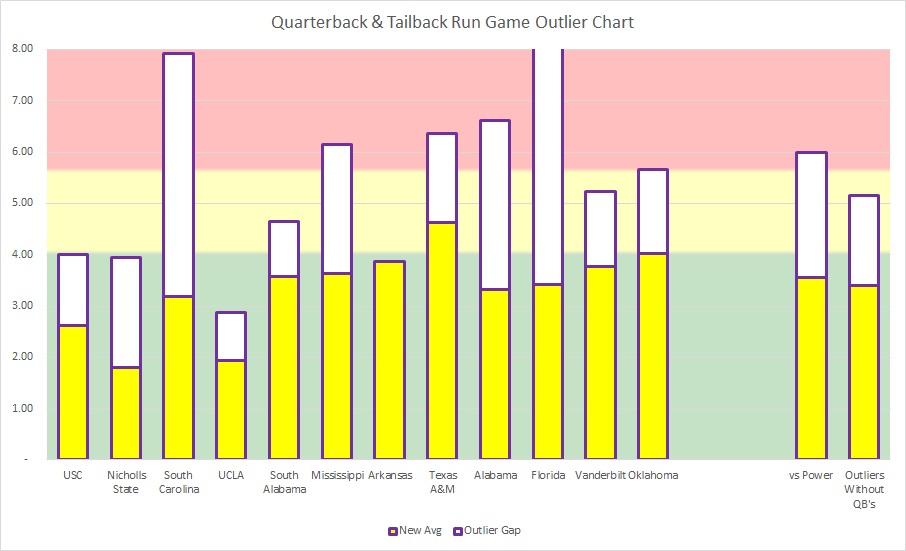
On the ground, they aren’t all that strong despite throwing a fair amount of scheme at the run. Running QBs in particular have given them issues.
| LSU vs P4 | Other P4 vs Opponents | 2023 vs P5 | |
| Yards/Rush | 4.66 | 4.04 | 4.54 |
| Yards/Non-Sack Carry | 5.79 | 4.75 | 5.42 |
| QB Non-Sack YPC | 8.17 | 5.77 | 6.14 |
| Non-QB YPC | 5.23 | 4.57 | 5.38 |
| Run Play % | 48.83% | 52.27% | 47.43% |
Their run defense has really struggled and even more so with QBs involved in the run game. Sawyer’s legs could be impactful in this game. Other than UCLA everyone was at least decent on the ground in per-carry average while South Carolina, Alabama, Florida, A&M, and Ole Miss gave them serious issues.
Special Teams & Field Position
They are an accomplished kick return team (10th in average yardage) but allow sizeable returns on kickoffs as well ranking 118th. However, they get touchbacks nearly all the time ranking 3rd nationally in touchback percentage. They are 83rd nationally in punt return average allowed so Baylor does have an opportunity there. LSU is also not very good at their own punt returns ranking 124th. They typically have a yard or so disadvantage in starting field position.
| LSU vs P4 | Other P4 vs Opponents | 2023 vs P5 | |
| Kick Return Average | 24.74 | 21.59 | 17.81 |
| Punt Return Average | 4.4 | 6.43 | 6.25 |
| Opponent Kick Return Avg. | 26 | 20.23 | 22.69 |
| Opponent Punt Return Average | 9.38 | 6.95 | -0.5 |
| Average Field Position | 71.28 | 71.55 | 72.76 |
| Opponent Average Field Position | 70.31 | 70.6 | 71.4 |
| Touchback Kickoff % | 91.67% | 64.28% | 48.61% |
| Opponent Touchback Kickoff % | 62.96% | 62.55% | 63.49% |
Their field position difference probably played a role in their losses to A&M, and Florida. The only winning power conference opponent where they enjoyed a sizeable lead in starting field position was against Arkansas and the Hogs turned it over on 30% of their drives in that one which took them from averaging roughly equal starting position to holding a 17.6-yard advantage.
Key Takeaways
- This offense is strong yardage-wise but is much more dangerous in the air. If Baylor can limit the run by playing a man down in the box it will be huge.
- Defensively LSU improved but I still don’t think they have been very strong. I expect Baylor to move the ball consistently on them.
- The kick return games for both sides will likely be limited by touchbacks. The punt return game could be big for Baylor though when they do get stops.
- LSU wants to disrupt defensively. When Baylor has a chance to hit the big plays LSU is risking to get negative plays the Bears need to hit.
- This game is probably going to be fun to watch with lots of big plays.
Follow @Baylor_S11 on X!
