S11 Preview Part 1: Deep Dive into Auburn’s Identity of Red Zone Woes & Explosive Plays

This is part one of my Baylor-Auburn preview series covering the statistics of the opponent. Future articles will cover roster & scheme.
Hugh Freeze’s Tigers Showed Flashes in 2024, Looking For Another Gear in 2025
Hugh Freeze is Auburn’s head coach. He got the Tigers' job after successful stints at Liberty and Ole Miss, where he showcased innovative offenses and, importantly for Auburn fans, he beat Alabama. He’s in year three and hasn’t mastered the turnaround yet, but with a big transfer portal class and some returning stars, there is optimism for 2025.
Below is a combination of charts and tables to help us understand the resume from last year. The tables compare Auburn's performance against its Power 4 opponents with that of other Power Four teams against the same opponents. The charts will feature a given metric, with Auburn represented in orange and blue, and either the opponent in their colors or other Power Four teams on their schedule in gray. The backgrounds will be shaded green, yellow or red, respectively, to indicate whether a metric is performing well, average or poor.
Offense
This offense showed the ability to get after some teams, but disappeared massively from three to four games as well. It flashed potential with solid performances against Oklahoma, Georgia and Kentucky, yet it disappeared against California, Missouri, and a less-than-dominant Vanderbilt defense.
Overall, it’s a unit that did enough to scare you, but its performance could vary significantly from week to week.
Offensive Overview Stats
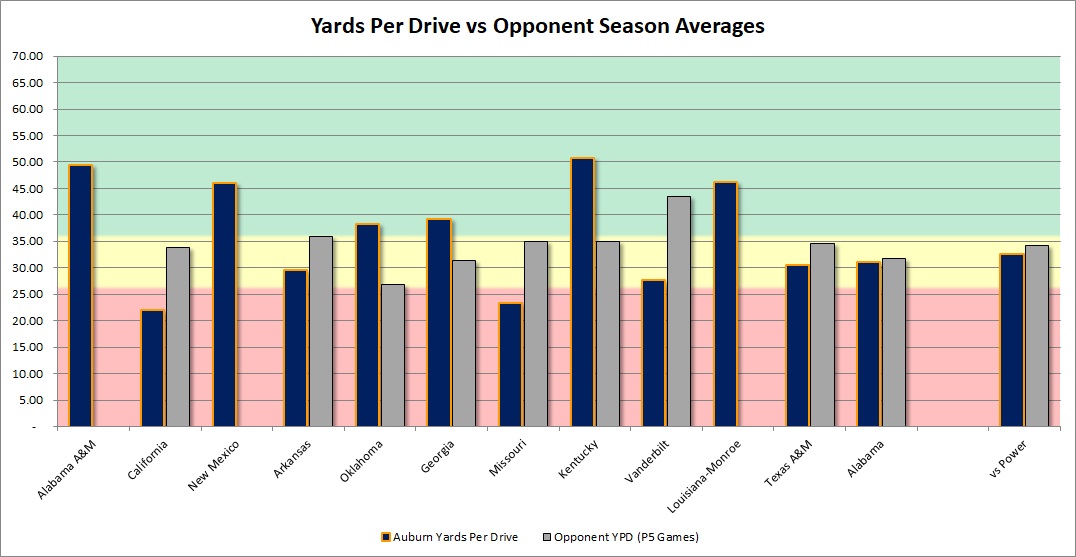
The Tiger offense faced some solid defenses but underperformed their power conference schedule in yards per drive, red zone scoring, turnovers and in converting third downs.
| Auburn 2024 vs P4 | Other P4 vs P4 Opponents | |
| Yd Drive | 32.52 | 34.03 |
| Points Per Red Zone Trip | 3.62 | 4.76 |
| Turnovers Per Game | 1.89 | 1.41 |
| Yards Per Play | 6 | 5.6 |
| Total Yards | 390.56 | 372.4 |
| % Of Drives Scored | 26.21% | 39.28% |
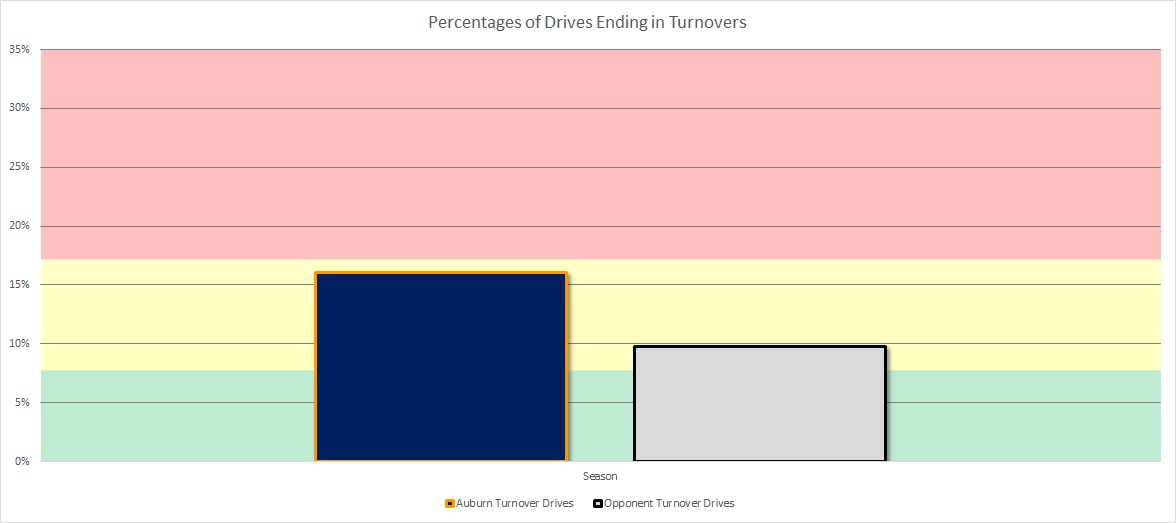
| % Turnover Drives | 16.5% | 12.88% |
| 3rd Down % | 35.96% | 39.15% |
| 3rd or 4th Down % | 42.11% | 47.01% |
However, they did a better job than expected on yards per play, which is somewhat due to being able to hit a decent percentage of explosive 20-yard plays that spiked the average.
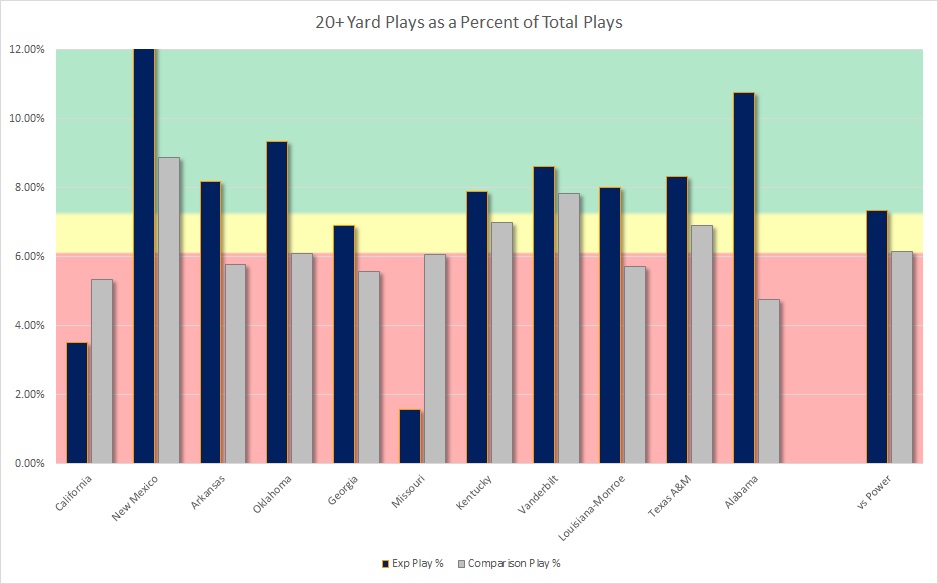
They lit up most of the teams on their schedule for more 20-plus yard plays than they usually give up. Cal and Mizzou were the notable exceptions, and keeping those big plays to a minimum helped the Bears and Tigers knock off Auburn and contributed to both holding Auburn under 24 yards per drive on average.
Complicating matters is that if they didn’t go boom with big plays, their third and fourth down conversion rates combined for a largely pedestrian total against P4 squads. Here is a chart showing the blue bars as their third-down conversion rates. The light bars are stacked on top. That’s the added percentage they eventually converted on fourth down. So, of their third down chances, what did they convert on the next two downs? We see they desperately needed fourth down against Vanderbilt and Oklahoma, but really relied on third down for most of the other games.
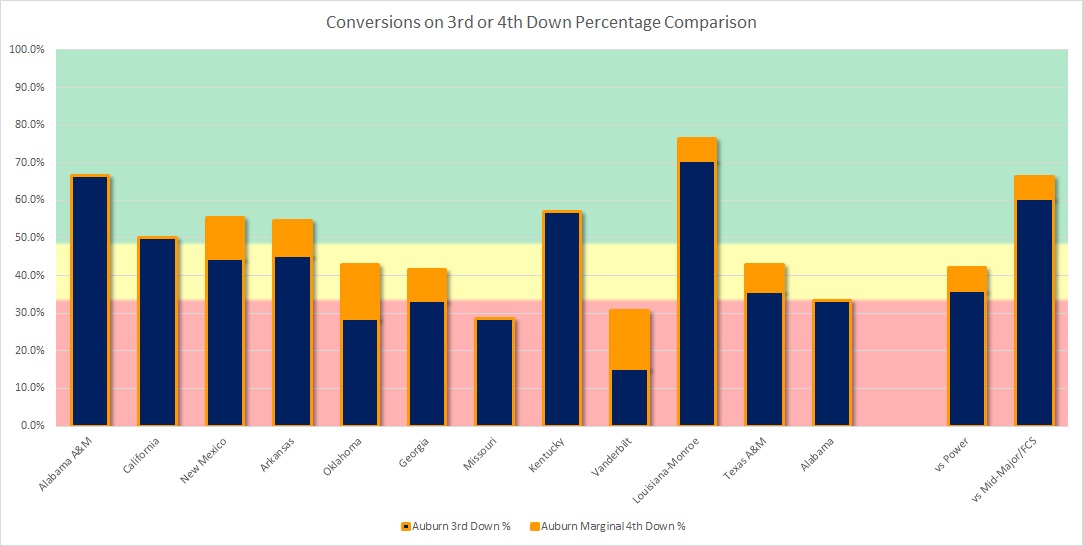
The red zone issues were huge, as were turnovers. Auburn’s red zone offense and defense looked big against mid-majors and FCS teams but largely disappeared against P4 teams. They hammered Kentucky on third down and did well enough against Cal, but disappointed massively compared to benchmarks against Mizzou and Vandy.
Complicating things further is that, despite getting into scoring range with those explosive plays, they were inefficient at converting them to points. So it was an offense that could shatter you or simply sputter.
Offensive Passing Game
This offense hit pretty similar numbers to what opposing defenses usually allowed, with the exception of allowing more sacks and throwing a higher percentage of interceptions.
| Auburn 2024 vs P4 | Other P4 vs P4 Opponents | |
| Completion Percentage | 61.51% | 62.32% |
| Yards/Att | 7.83 | 7.65 |
| Yards/Completion | 12.73 | 12.27 |
| Yards/Pass Including Sacks | 6.55 | 6.72 |
| Sack % | 8.85% | 6.67% |
| INT % | 4.26% | 2.42% |
An entirely new quarterback room will address the interceptions, but the sacks must be handled to have a chance of growing into the offense they want to be. Kentucky, Vandy, Mizzou, Georgia, Oklahoma and Cal all got a strong sack percentage on these guys.
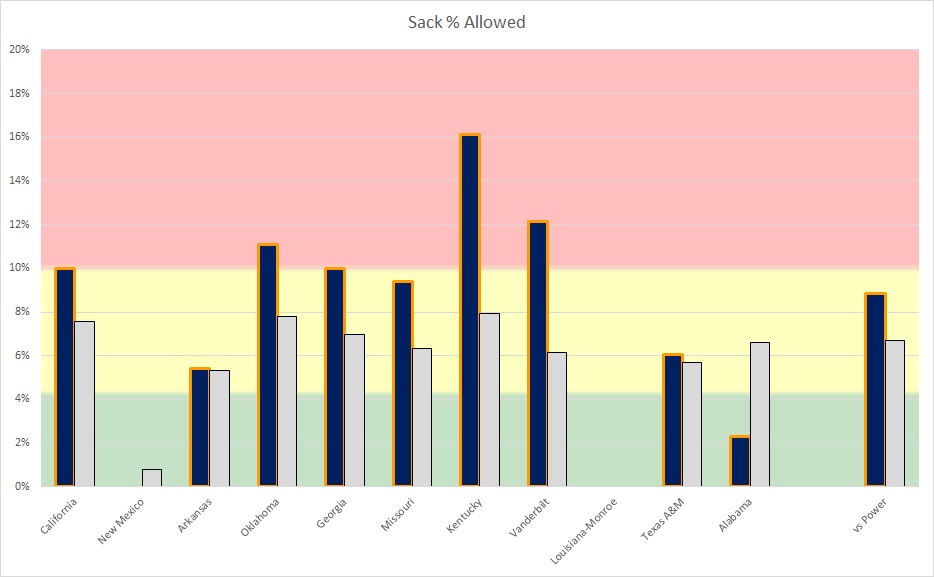
Auburn added two of USC and Virginia Tech’s starting tackles to try and shore this up.
Offensive Run Game
On the ground, they did a productive job outpacing what the stat sheet expected from their schedule.
| Auburn 2024 vs P4 | Other P4 vs P4 Opponents | |
| Yards/Rush | 4.34 | 3.89 |
| Yards/Non-Sack Carry | 5.4 | 4.54 |
| QB Non-Sack YPC | 5.24 | 4.77 |
| Non-QB YPC | 5.55 | 4.69 |
| Run Play % | 47.95% | 51.2% |
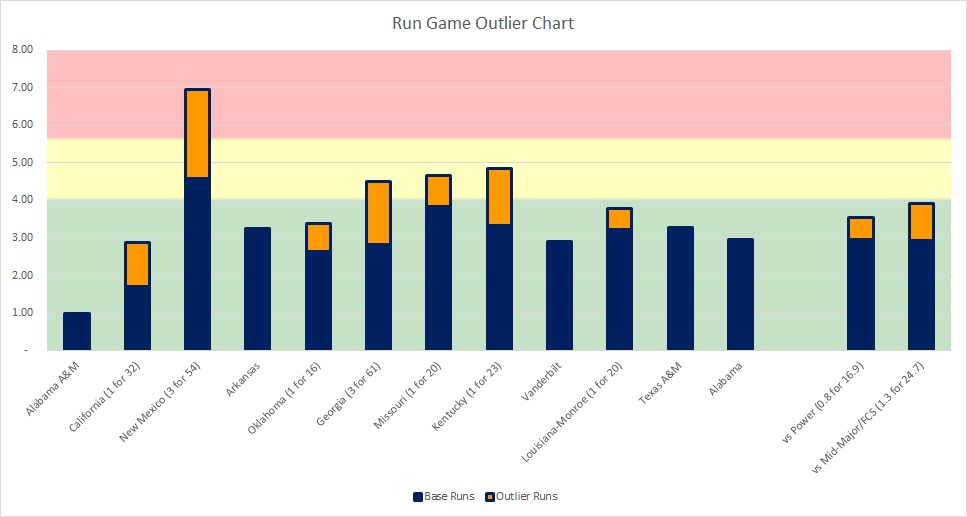
Below is an outlier chart where the combined stacked bars vertically equal the offense’s non-sack yardage per carry from the running back position. The stacked orange bars show how a small number of “outlier runs” of around 16-20 yards or more contribute to the tailback yards per carry average.
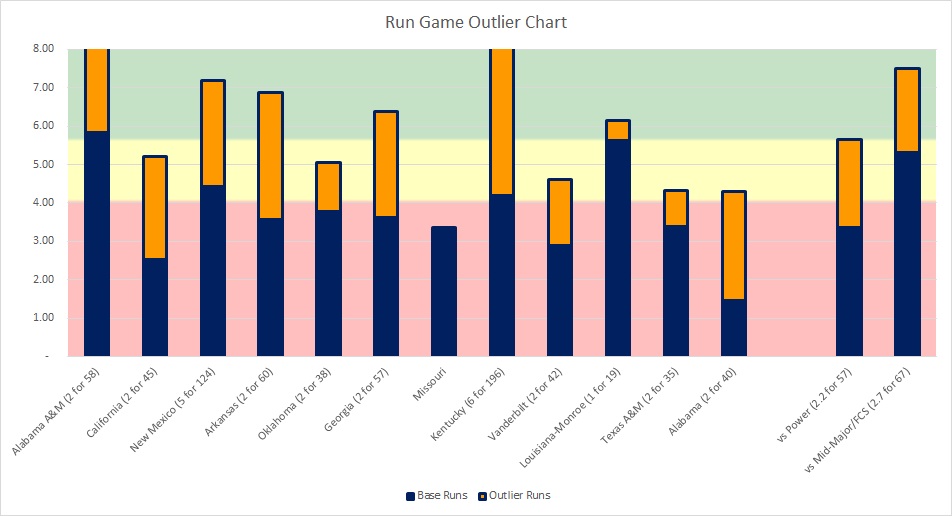
This offense got a sizeable chunk of their rushing production on big plays. They obliterated Kentucky’s run defense and the three lower division opponents; however, the rest of the slate slowed the run game down to some extent. Granted, Freeze uses the quarterback in the run game, and this chart won’t directly reflect that. He’ll have three dual-threat guys as options this fall, and they already averaged roughly nine non-sack QB runs last fall against power conference opponents, so they aren’t shy about using them as that number doesn’t include option read handoffs where the quarterback occupies a defender to spring the running back.
Defense
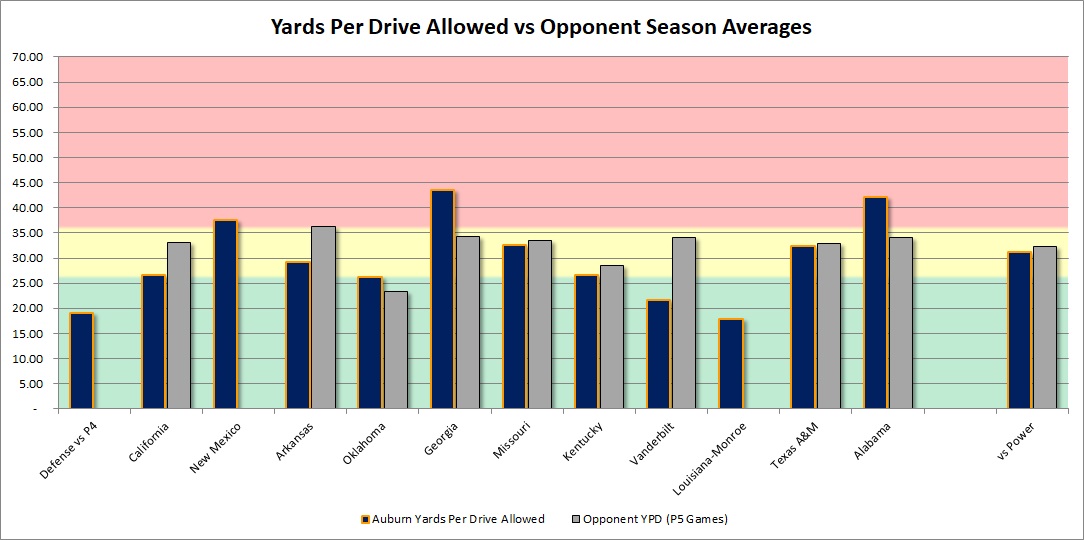
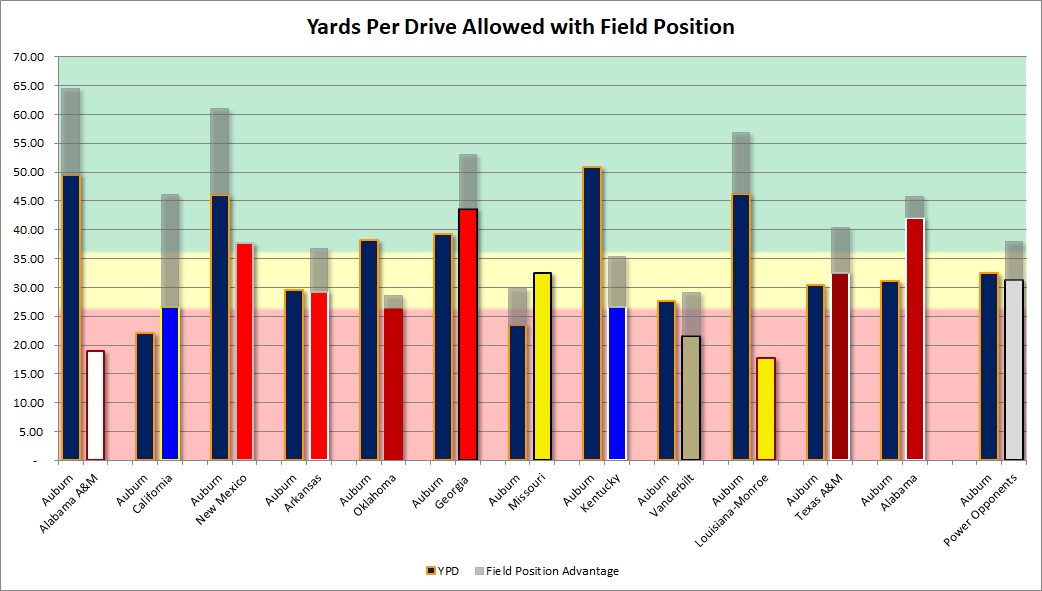
Defensively, the Tigers were consistently solid. Georgia and Bama had high yards per drive on them, and New Mexico had a great system with a highlight reel quarterback (both of which face Baylor against Utah), making it interesting, but Auburn largely slowed people down yardage-wise.
DJ Durkin’s first year as defensive coordinator delivered a pretty solid unit. That wasn’t perfect, but it created challenges for offenses.
Defensive Overview Stats
The Tigers did a good job on yards per drive, play and game, and matched schedule expectations on scoring drive percentage. They did struggle relative to their schedule on third and fourth down conversion rates, turnover drive rates and most notably in the red zone.
| Auburn 2024 vs P4 | Other P4 vs P4 Opponents | |
| Yards Per Drive | 31.21 | 32.37 |
| Points Per Red Zone Trip | 5.38 | 4.92 |
| Turnovers Per Game | 1.22 | 1.44 |
| Yards Per Play | 4.93 | 5.42 |
| Total Yards | 340.33 | 356.29 |
| % of Drives Scored | 36.73% | 36.32% |
| % Turnover Drives | 11.22% | 13.01% |
| 3rd Down % | 45.45% | 38.81% |
| 3rd or 4th Down % | 50.35% | 44.77% |
Their issues on third and fourth downs likely contributed to higher scoring rates allowed against Alabama, Georgia, and, to a lesser extent, Texas A&M.
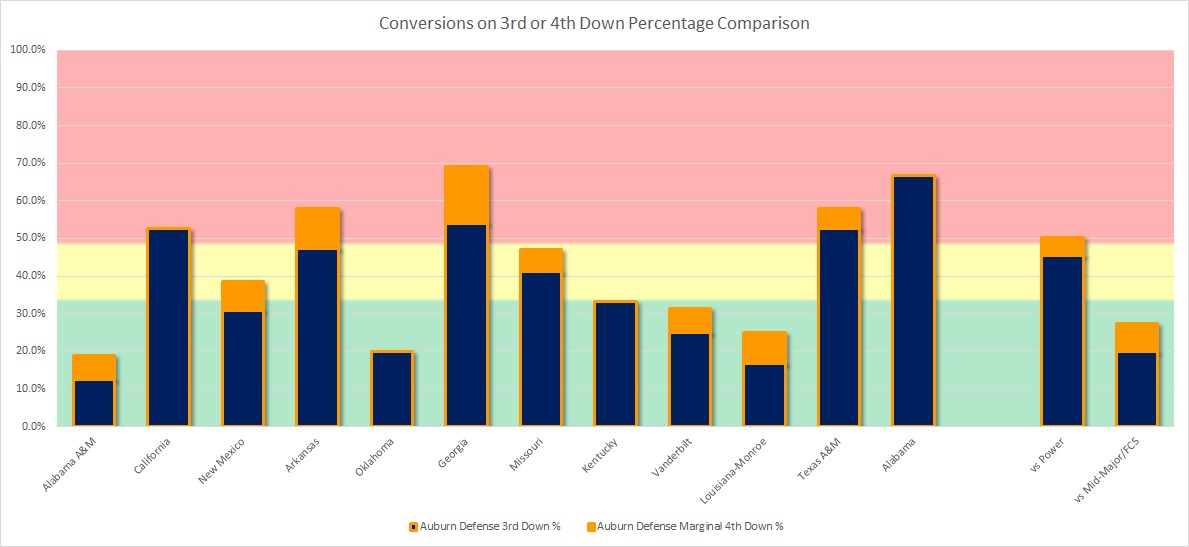
They did do well some weeks on it, though, holding a typically tough to get off the field Vanderbilt offense way below their usual consistency of nearly 50% on either third or fourth down against other P4s. Dave Aranda’s willingness to extend drives by rolling the dice on fourth down could be an inflection point for this game.
Defensive Passing Game
Against the pass, they allowed fewer completions but were largely consistent with what other defenses allowed their opponents to do. A little less on the sack or interception percentage, but not dramatically so.
| Auburn 2024 vs P4 | Other P4 vs P4 Opponents | |
| Completion % | 58.46% | 61.04% |
| Yards/Att | 7.33 | 7.42 |
| Yards/Completion | 12.55 | 12.16 |
| Yards Pass Play Including Sacks | 6.31 | 6.22 |
| Sack % | 7.8% | 8.5% |
| INT % | 2.13% | 2.61% |
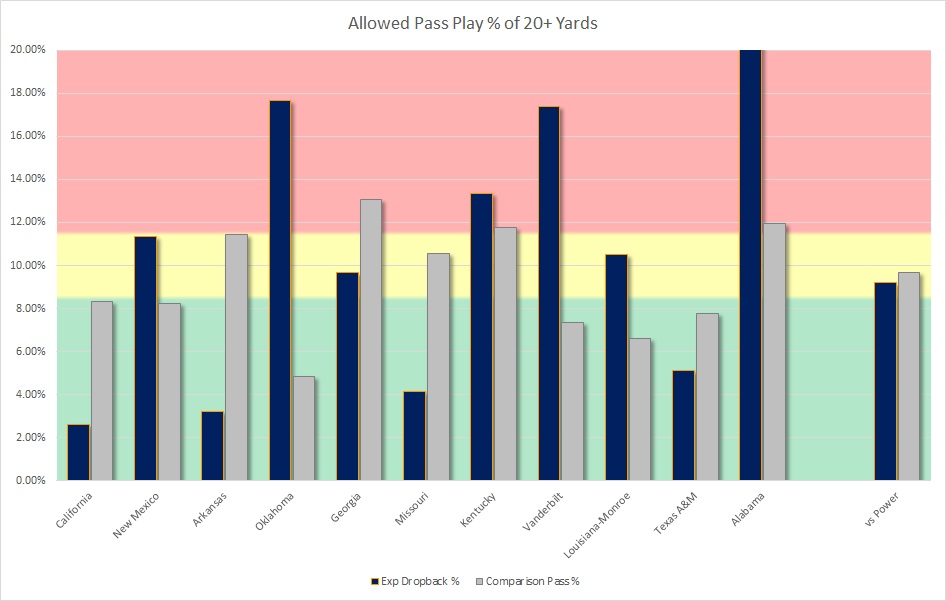
With that said, teams were able to hit some big plays on them as well, with Bama, Oklahoma, Vanderbilt and New Mexico all changing the complexion of their games with their ability to hit a high percentage of 20+ plays.
Defensive Run Game
Against the run, the Tigers did a really solid job limiting opposing tailbacks. Every metric here is beneficial for comparison.
| Auburn 2024 vs P4 | Other P4 vs P4 Opponents | |
| Yards/Rush | 3.2 | 3.8 |
| Yards/Non-Sack Carry | 3.78 | 4.66 |
| QB Non-Sack YPC | 4.94 | 5.43 |
| Non-QB YPC | 3.55 | 4.53 |
| Run Play % | 54.59% | 51.13% |
Teams largely didn’t do much on them, even if we look at the tailback carry outlier chart. Ironically, New Mexico, with its dynamic scheme and dual threat, made more things happen than the rest. Unfortunately for Baylor, as a side note, both the OC and QB are lining up for Utah when the Utes come to Waco this fall.
Special Teams & Field Position
They were solid covering kicks and average in kick returns, but had over two-thirds of kickoffs go for touchbacks.
| Auburn 2024 vs P4 | Other P4 vs P4 Opponents | |
| Kick Return Average | 19.53 | 22.13 |
| Punt Return Average | 5 | 6.62 |
| Opponent Kick Return Avg. | 21.8 | 19.7 |
| Opponent Punt Return Average | 5 | 6.47 |
| Average Field Position | 74.64 | 70.89 |
| Opponent Average Field Position | 67.94 | 71.14 |
| Touchback Kickoff % | 68.57% | 63.66% |
| Opponent Touchback Kickoff % | 56.82% | 62.22% |
However, they struggled with field position disadvantages of seven yards or so on average in the P4 games they played. Cal, Arkansas, Oklahoma, Georgia, Vanderbilt and Alabama all benefited from it in wins over the Tigers, and Texas A&M benefited in a loss.
Contributing to a tougher field position setup was their turnover margin. They simply didn’t force a ton of turnovers and coughed it up a lot. Pair that with red zone issues, and it’s a recipe for losing close games.
Final Thoughts
- Auburn is a solid team, but they still have some issues. They added a lot of guys, but even if they all fix the issues, how long will it take for them to gel into a cohesive unit? The same question applies to Baylor’s secondary, however, and it should be an interesting game one.
- I was surprised at the issues in the red zone, given how well they recruit. If that continues for them, that’s a huge edge to Baylor.
- Given that Baylor is breaking in a different main kickoff guy, I am glad to see that their kick return yardage was not prolific. The Bears had a habit of getting touchbacks, and the new guy might not consistently hit that mark.
- The Tiger defense will likely be a tough test for the offense. If Baylor does well here, it bodes very well.
Follow @Baylor_S11 on X!