There will be a film preview of Baylor vs. Texas Tech dropping later this week, but here is a primer on Baylor's opponent from a perspective of numbers. This piece compares Tech's statistics against their power conference opponents to what those teams gave up to other power five teams. I'll possibly mention relevant stats from a non-P5 game but will mostly use their multiple games against other P5 teams to set an expectation of what is reasonable. In golf terms, "What is par for this course?" The intent of this piece is to shed light on that and give a better picture of the team that is next on Baylor's schedule.
Texas Tech Offense
SicEm365
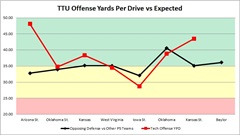
Texas Tech Yards Per Drive vs Opposing P5 Defenses YPD Expectation
The Red Raiders have lived up to their decade and a half reputation of having a very capable offense that throws the ball very well. Over the course of the season they average 109.4% of the yards per drive that their Power 5 opponents typically give up to other Power 5 teams. This isn't as crazy as some past Tech offenses but they do a very good job of placing defenses under stress. Their most impressive outing was against Arizona State where they put up 48 yards per drive against a defense that has been reasonable against other power conference foes. Their worst outing was Iowa State where they were held to 28.7 yards per drive and scored on 18% of their offensive possessions.
Offensive Overview Stats
About the only bad statistic here on offense is that against Power 5 teams they have been slightly subpar in the red zone and score .75 points less than expected per-trip. They are very efficient on third down and beat expectations on almost all of these stats.
| Statistic |
Texas Tech Offense |
P5 Opponents vs Other P5 Offenses |
| Yards Per Drive |
38.1 |
34.96 |
| Points Per Drive |
2.81 |
2.32 |
| Points Per Red Zone Trip |
4.13 |
4.88 |
| Turnovers Per Game |
1.43 |
1.37 |
| Yards Per Play |
6.35 |
6.01 |
| Yards Per Game |
487.86 |
435.75 |
| % Of Drives Scored |
42.7% |
40.22% |
| 3rd Down % |
48.41% |
38.81% |
Offensive Passing Game
This team throws it more than most and does a very good job of it. They don't average dramatically high yards per attempt or completion compared to other offenses their opposition faces like the two Oklahoma offenses but they are efficient with it and do a good job avoiding interceptions and protect well enough to beat expectations on sack percentage.
| Statistic |
Texas Tech Offense |
P5 Opponents vs Other P5 Offenses |
| Completion % |
68.15% |
61.1% |
| Yards/Attempt |
8.29 |
8.19 |
| Yards/Completion |
12.16 |
13.41 |
| Yards/Pass Play Including Sacks |
7.52 |
7.44 |
| Sack % |
4.58% |
4.77% |
| Interception % |
1.96% |
2.33% |
Offensive Run Game
The Tech run game is capable and does a good job when they sparingly turn to it while outperforming expectations in every statistic listed except for Yards/Rush which includes sacks like most box scores start out doing. Once those are removed the Red Raiders separate from the pack.
| Statistic |
Texas Tech Offense |
P5 Opponents vs Other P5 Offenses |
| Yards/Rush |
4.26 |
4.25 |
| Yards/Non-Sack Carry |
5.06 |
4.8 |
| QB Non-Sack YPC |
4.96 |
4.9 |
| Non-QB/Non-Team YPC |
4.78 |
4.53 |
| Run Play % |
43.12% |
50.88% |
Texas Tech Defense
SicEm365
Texas Tech Defensive YPD vs P5
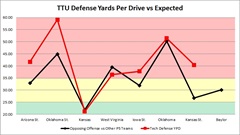
The Texas Tech defense has improved since the last two seasons but is still not where they want to be. They allow 117% of what their power league opponents typically generate against P5 teams and have not held any P5 team other than Kansas below 35 yards per drive. Their worst outing was giving up 59 per drive to Oklahoma State and their second best was holding WVU to 36 when they average 39.5. They also struggled compared to expectations against ASU and KSU allowing 13 and 8 more yards per drive than those teams typically get.
Defensive Overview Stats
The overall stats don't show a very pretty picture. They manage to outperform yards per play but allowing almost 10% more on third down conversions makes that tough to find success with. They allow .7 more points per drive and that likely has to do with a red zone defense that allows almost a full point more per trip than those offenses typically get. Tech has improved but key areas are holding them back.
| Statistic |
Texas Tech Defense |
P5 Opponents vs Other P5 Defenses |
| Yards Per Drive |
41.12 |
35.42 |
| Points Per Drive |
2.97 |
2.28 |
| Points Per Red Zone Trip |
5.85 |
4.94 |
| Turnovers Per Game |
1.43 |
1.66 |
| Yards Per Play |
6.24 |
6.29 |
| Yards Per Game |
468.57 |
438.63 |
| % Of Drives Scored |
49.41% |
38.51% |
| 3rd Down % |
44.84% |
35.95% |
Defensive Passing Game
Pass defense has had it's struggles for them. Tech allows 8% more completions which mitigates how much their lower completion and attempt yardage stats help them. They are slightly below expectations on sacks and interceptions.
| Statistic |
Texas Tech Defense |
P5 Opponents vs Other P5 Defenses |
| Completion % |
66.54% |
58.85% |
| Yards/Attempt |
7.96 |
8.47 |
| Yards/Completion |
11.96 |
14.4 |
| Yards/Pass Play Including Sacks |
7.25 |
7.71 |
| Sack % |
4.46% |
5.09% |
| Interception % |
2.6% |
2.72% |
Defensive Run Game
Tech's run defense is better than it's pass defense right now but still has it's limitations. They allow more yards per carry overall and from the tailback spot than opponents usually get.
| Statistic |
Texas Tech Defense |
P5 Opponents vs Other P5 Defenses |
| Yards/Rush |
4.65 |
4.5 |
| Yards/Non-Sack Carry |
5.25 |
5.1 |
| QB Non-Sack YPC |
4.23 |
5.42 |
| Non-QB/Non-Team YPC |
5.39 |
4.68 |
| Run Play % |
48.86% |
49.33% |
Return Game
Tech's kickoff return is slightly better than expected against P5 teams and below par on Punt Returns. They do a decent job limiting punt returns but allow a higher than expected kickoff return average.
| Statistic |
Texas Tech |
Other Teams vs P5 Opponents |
| Kick Return Average |
21.56 |
20.92 |
| Punt Return Average |
6.88 |
10.94 |
| Kick Return Average Allowed |
27.11 |
20.6 |
| Punt Return Average Allowed |
8.14 |
7.92 |
Follow @Baylor_S11 on Twitter!


