Stats In Review: Baylor's offense elite during wild win in Texas Bowl
The Texas Bowl was one of the most exciting bowl games of 2018. The game had big plays, lead changes, and two very motivated teams from the top two conferences in 2018. Charlie Brewer, Ke’Shaun Vaughn, Denzel Mims, Kyle Schurmur, Trestan Ebner, James Pinkney and others traded big blows all night. So what can we say that is a little more detailed regarding each side of the ball?
Yards Per Drive Overview
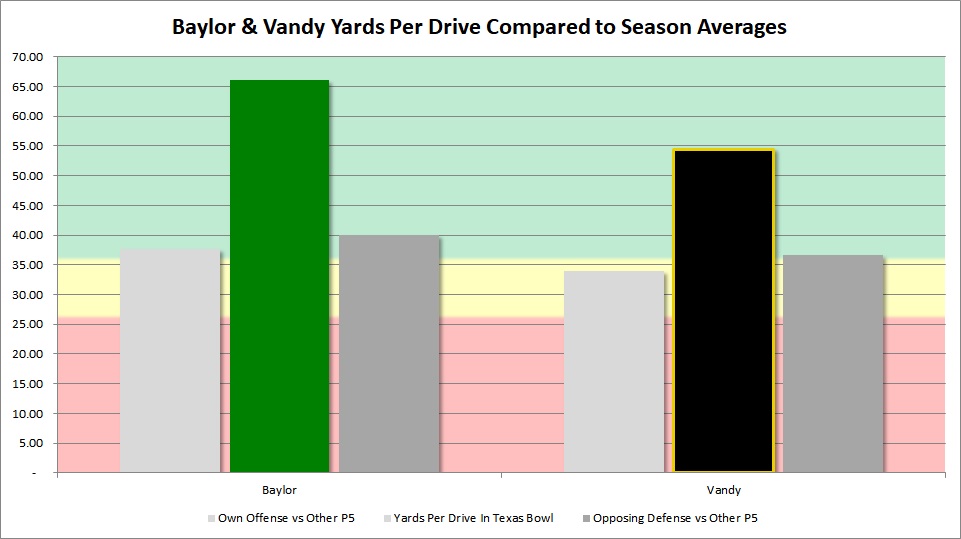
Each team took the other’s defense and set a new high for yards per drive for both the offenses and the defenses. Here’s the quick view of each team compared to what each offense and defense averaged against other Power 5 teams (including Notre Dame) this season.

As you can see, both offenses ended up with a result well beyond what the opponent typically gave up and well above their usual output.
Big Plays
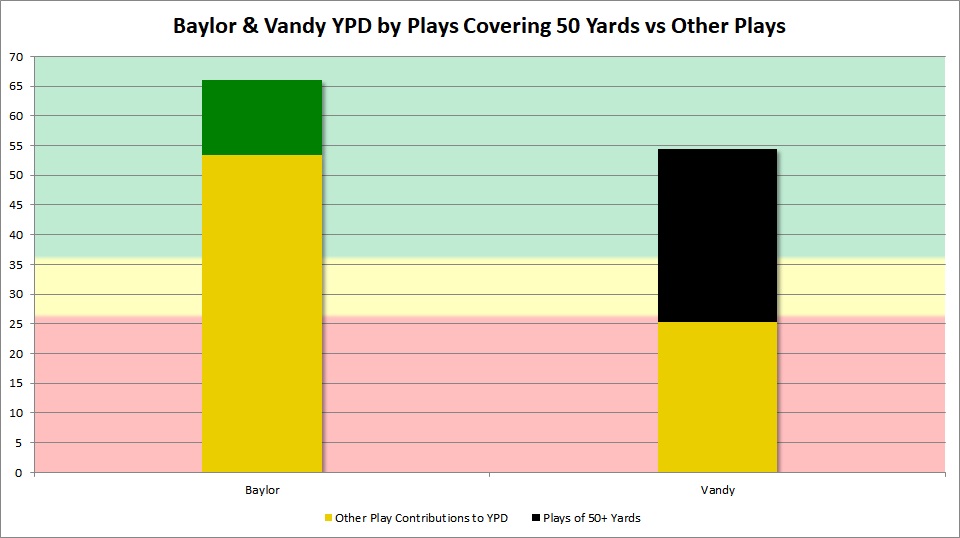
The big difference to me was how each team racked up their yards. Vandy was extremely reliant on the big play with four of over 60 and another over 50, but only two other plays over 20 yards in additional 57 plays. Baylor was no slouch on offense with a lot of 10-yard and 20-yard plays, but with only two plays over 40 they weren’t going the majority length of the field on big plays as often as Vandy. Below we see the plays that went 50+ yards proportionally to how much they contributed to each team’s yardage per possession.

Vandy’s five big plays took their yardage per drive from relatively average or poor figure (25 YPD) to exceptional. Baylor, on the other hand, consistently moved the ball as well as Vandy’s exceptional total yards per drive even without their two 50-plus yard plays spiking things. On drives that the team did not hit one of their long plays over 50 yards Vandy scored a total of three points (.5 per drive) but moved the ball reasonably well with 39 yards per drive while Baylor was still moving it like crazy averaging almost 64 yards and scoring 31 points (3.88 per drive). Both teams averaged 7 points per drive when they hit a play over 50.
This highlights two things:
- Baylor must do a better job of limiting big plays or else they will probably lose. Here they had per-drive yardage production that was incredible with high points per drive and still won by only a score. Big plays were a giant issue.
- It feels a little crazy pointing it out after giving up 50+ per drive but the Bears weren’t THAT far away from a much better night. One or two better plays in recognizing a screen, a NT not getting reached on outside zone, or not following a jet sweep fake would have had a massive impact in this game by denying one of these long plays.
Defense (Let’s get the bad news done first...)
Anytime you allow over 50 yards per drive and five plays of over 50 yards it’s ugly.

Defense vs Vandy Overview
All of these overview stats are bad except for staying even on turnovers as the fumble recovery in the red zone was a big game impacting play. With that said, they did limit things on other plays holding Vandy’s other 57 plays to lower yards per play than what Vandy averaged vs other power five teams. That is once again one of the most frustrating parts of this defensive game. In no way is this good but it is something to reach for next year.
| Vanderbilt 2018 vs Other P5's | In Texas Bowl | No 3 Runs or Screen | |
| Yards Per Drive | 33.91 | 54.36 | |
| Points Per Red Zone Trip | 4.91 | 5.67 | |
| Turnovers Per Game | 1 | 1 | |
| Yards Per Play | 5.71 | 9.24 | 5.26 |
| Yards Per Game | 378.44 | 573 | 305 |
| % Of Drives Scored | 37% | 55% | |
| 3rd Down % | 31.86% | 53.85% |
Defense vs Vandy Passing Game
Baylor didn’t do well against the Vandy passing game but were able to create some issues for Shurmur forcing Vandy to a very low completion percentage. The long screen play and the 52 yard pass to Abdur-Rahman where the Bears missed two tackles that would have denied most of that after-catch gain skewed things upwards a bit. Vandy really only hit three long downfield throws all night. The long pass to Abdur-Rahman where he sat down in zone then ran for 30 more, a post route to Pinkney where Shurmur threaded it between Tampa 2 zone, and the one sideline pass that was an incredible throw against tight man coverage by Jameson Houston.
When we try to isolate their dropback passing results outside of the screen play, the Bears held Vandy below their yards per pass play and yards per attempt against other P5 teams. One of very few bright spots for a defense that had a rough night. The Bears also struggled to get consistent pressure on Shurmur with results for sack and hurry percentages that are well below what other P5’s did. Part of that was Shurmur getting rid of it quickly or making good use of play action but it needs to improve.
| Vanderbilt 2018 vs Other P5's | In Texas Bowl | No 65 Yard Screen Play | |
| Completion % | 61.95% | 47.37% | 45.95% |
| Yds/Att | 7.22 | 7.53 | 5.97 |
| Yds/Comp | 11.66 | 15.89 | 13.00 |
| Yards/Pass Play Including Sacks | 6.33 | 7.26 | 5.74 |
| Sack % | 6.01% | 2.56% | |
| Sack or Hurried % | 14% | 7.89% | |
| Int % | 1.27% | 0% |
Defense vs Vandy Run Game
The Bears did poorly against Vandy because allowing one long run for a touchdown isn’t going to ever be good, much less three. Outside of those three carries though the Bears did limit Vandy to fewer yards per carry with sacks, without sacks, by the QB, and by non-QB’s. It was either a big play or it was usually not much as Vandy tailbacks averaged 4 per carry outside the long runs which is solid for the defense on those plays, but does not excuse the others.
Side note: Ke’Shaun Vaughn was incredible that night and is going to be fun to watch playing against someone else going forward.
| Vanderbilt 2018 vs Other P5's | In Texas Bowl | No 3 Runs | |
| Yards/Rush | 4.22 | 11.96 | 4.00 |
| Yards/Non-Sack Carry | 5.02 | 12.61 | 4.35 |
| QB Non-Sack YPC | 8.66 | 5.67 | 5.67 |
| Non-QB YPC | 5.09 | 13.65 | 4.12 |
| Run Play % | 46.98% | 37.1% |
Offense (Finally...)
Baylor’s offense was outstanding against Vanderbilt with one of the most consistently dominant performances we’ve seen and one that is right up there with the best outings the prior staff had.

How effective was Baylor?
- They averaged 66.1 yards per drive. That is the highest in any game vs. any Power 5 defense this year and third highest in any game of 2018.
- They averaged 4.5 points per drive while missing a field goal from the Vandy 8 and dropping a likely touchdown on 1st down from the 18 that miraculously was intercepted. They were very close to 5.5 per drive which is incredible. For context, Oklahoma averages 4.2 over the course of this season and is first nationally.
- They converted on either third or fourth down on 11 of 14 times that Vandy forced Baylor into third down excluding the final play of the game to kill the clock. The times they were stopped? A field goal, a missed field goal, and a badly dropped pass to a wide open Mims where he had room to pick up a lot more yards than just the conversion. Vandy couldn’t get the Bears off the field all night.
- Vandy only sacked or officially hurried Brewer on only two out of 37 estimated plays (sacks + attempts) and he consistently hit his receivers for almost 62% completions despite getting a lot of tight coverage playcalls.
- Baylor’s run game went for almost 300 yards and 6.59 yards per non-sack carry. Even when you take away their longest run (34 yards) it’s still an outstanding 5.95.
Overall it was a dominant performance that was both explosive and consistent which points to good things in the future when the line gets a bit better.
Baylor Offense vs Vandy Overview Stats
The stats below are ALL good on their own and all stronger than what other P5’s averaged except for red zone points and third down percentage. Third down percentage would be 50% without the Mims drop so it’s not far off. Without that drop the conversion rate on either third or fourth would jump to 85.7%.
The Bears had a low number in the red zone that was almost a really good number had they made a short field goal and caught the touchdown on the interception play or finished that drive with a TD. Those two plays dramatically turned this game towards Vandy wasting 59 yard and 67 yard drives with no points. While Vandy missed a field goal they were also 19 yards further away.
One stat that jumped out to me: Baylor scored on 70% of its drives. With a better field goal attempt and without the interception, that number probably jumps to 90%. That is incredible against anyone, much less an SEC team.
| Vanderbilt 2018 vs Other P5's | In Texas Bowl | No 2 Passes & Ebner Run | |
| Yards Per Drive | 40.02 | 66.1 | |
| Points Per Red Zone Trip | 4.67 | 4 (5.67 if FG is made and Mims catches INT Ball) | |
| Turnovers Per Game | 1.67 | 1 | |
| Yards Per Play | 6.39 | 8.25 | 6.5 |
| Yards Per Game | 457.89 | 668 | 507 |
| % Of Drives Scored | 47% | 70% | |
| 3rd Down % | 47.15% | 42.86% (Excludes final clock kill) | |
| 3rd or 4th Down Converted % | 51.22% | 78.57% (Excludes final clock kill) |
Baylor Pass Offense vs Vandy
Baylor did effectively what most teams did to Vandy in the air per-play without the two long plays and with the long plays they considerably shot past expectations. They really didn’t let Vandy get to Brewer apart from two sack plays according to the offical numbers and yielded pressure half as often as Vandy is used to dealing with.
| Vanderbilt 2018 vs Other P5's | In Texas Bowl | No TD Passes to Ebner and Jones | |
| Completion % | 60.65% | 60% | |
| Yds/Att | 7.68 | 10.97 | 7.79 |
| Yds/Comp | 12.67 | 18.29 | 13.53 |
| Yards/Pass Play Including Sacks | 7.17 | 10.22 | 7.17 |
| Sacked or Hurried % | 11.7% | 5.41% | |
| Int % | 3.13% | 2.7% |
Baylor Run Offense vs Vandy
Baylor also did a good job in the run game averaging significantly more per carry, per non-sack carry, and per-quarterback carry than Vandy typically gave up. However, the Bears weren’t as effective on tailback carries and Brewer’s legs really helped get things going.
| Vanderbilt 2018 vs Other P5's | In Texas Bowl | No Ebner 34 Yard Run | |
| Yards/Rush | 5.42 | 6.17 | 5.56 |
| Yards/Non-Sack Carry | 5.76 | 6.59 | 5.95 |
| QB Non-Sack YPC | 4.59 | 8.21 | 8.21 |
| Non-QB YPC | 6.17 | 5.83 | 4.86 |
| Run Play % | 55.23% | 54.32% |
Special Teams
The only surprise in the return game was that neither team had a punt return. All kickoff returns were in a similar range. As far as field position, Vandy had their usual roughly four yard advantage in average starting position but the difference is that both they and Baylor started further back than usual. With 10 Baylor drives and 11 Commodore drives this only made a real difference of 40-44 “hidden” yards.
| Vanderbilt 2018 vs Other P5's | In Texas Bowl | |
| VU Kick Return Average | 18.05 | 18.5 |
| VU Punt Return Average | 10.73 | N/A |
| VU Opponent Kick Return Average | 22.2 | 20 |
| VU Opponent Punt Return Average | 7.14 | N/A |
| VU Average Field Position | 70.07 | 74.73 |
| VU Opponent Average Field Position | 74.39 | 78.6 |
Conclusion

Both teams have to like what they saw from their offenses but each has significant questions to answer on the defensive side. This made for a fun bowl game but both fanbases are probably hoping for some needed roster improvement on defense prior to next season.
Both teams need to improve their pass rush and the Bears really need to be more disciplined with their assignments. Vandy has to get better against the run and can’t expect to stop good offenses without some significant upgrades in their defensive front whether it’s from younger guys developing or from new guys being brought in.
I plan to do a film review of the game soon that will explore some of the bigger plays.
Follow @Baylor_S11 on Twitter!
