Enjoy this free statisical preview, typically a SicEm365 Premium piece, of Baylor’s upcoming opponent Oklahoma State
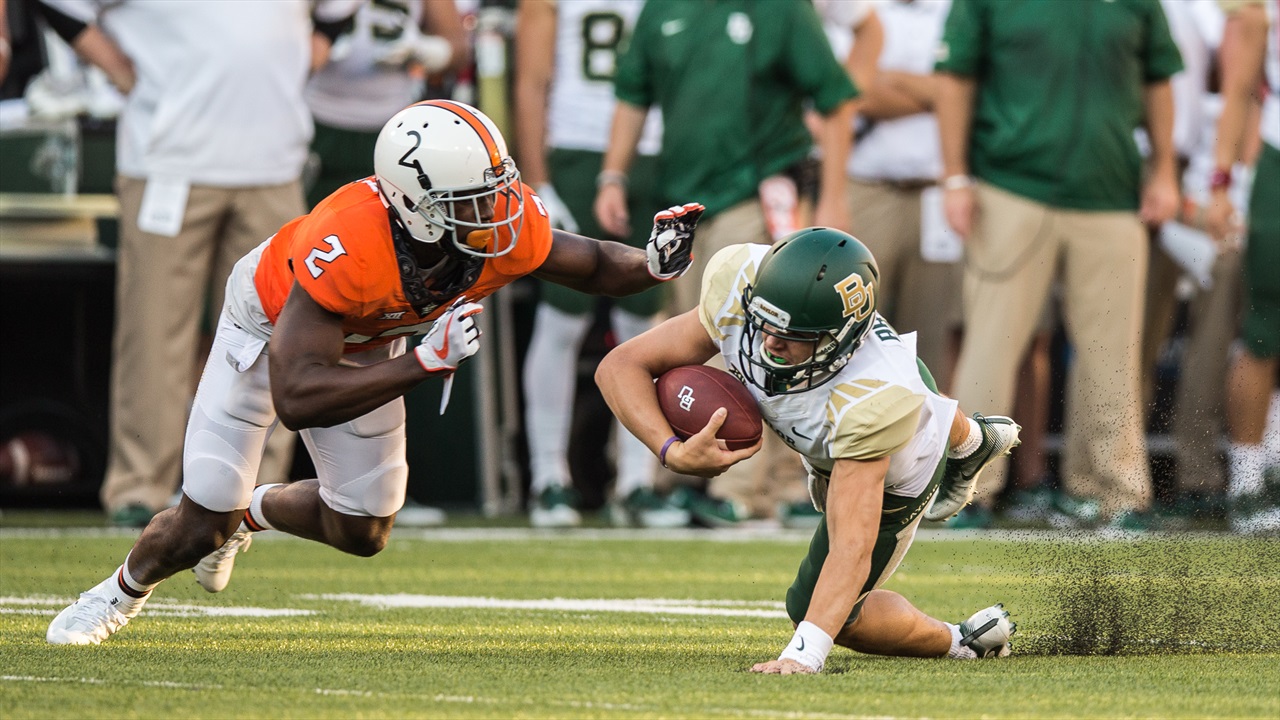
After a victory at home against Texas Tech the Bears head to Stillwater to take on Mike Gundy’s Oklahoma State Cowboys. The Cowboys are one of the most explosive and exciting teams in the country and will be a big challenge. What do they do well and where could some opportunities exist for Baylor to attack? We’ll address scheme and personnel later, here is our look at the numbers.
Offense
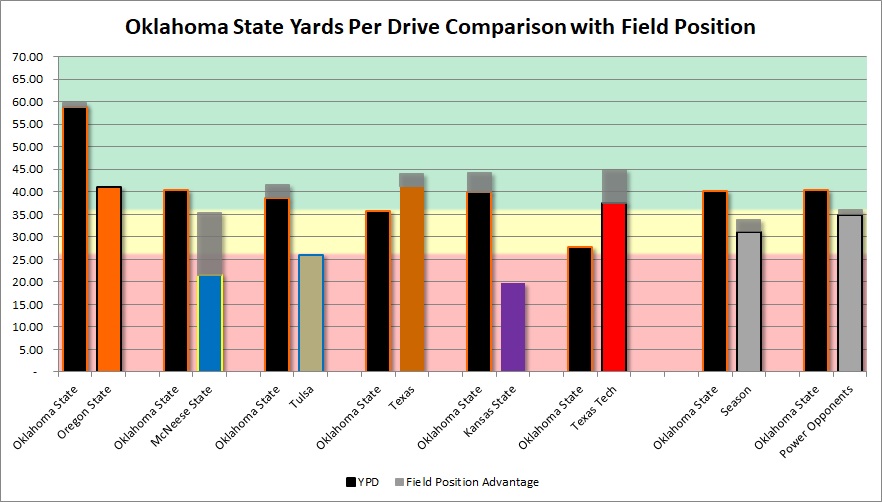
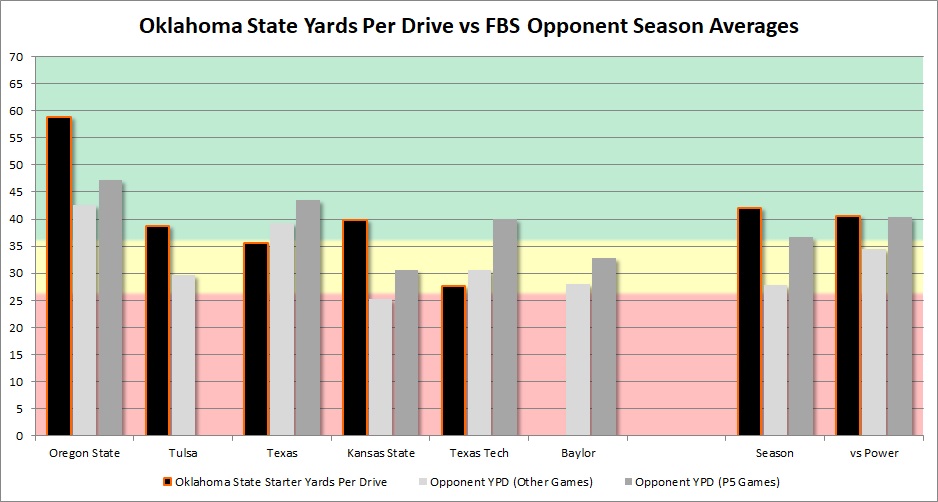
The Cowboy offense will usually outpace expectations in yards per drive. Their best outing was a domination of an admittedly bad Oregon State defense but the most impressive had to be what they did to a decent KSU defense. They struggled against Texas Tech and especially in the first half of that game.
Offensive Overview Stats
This team does an effective job on both yards per drive and points per red zone trip. They score on a high percentage of drives and they do a good job on third down. They struggle with turnovers
| Oklahoma State 2019 | Other FBS Teams vs P5 Opponents | |
| Yards Per Drive | 40.52 | 35.34 |
| Points Per Red Zone Trip | 5.06 | 5.28 |
| Turnovers Per Game | 2.25 | 1.46 |
| Yards Per Play | 6.37 | 6.26 |
| Yards Per Game | 521 | 414.99 |
| % Of Drives Scored | 45% | 38% |
| 3rd Down % | 43.75% | 36.37% |
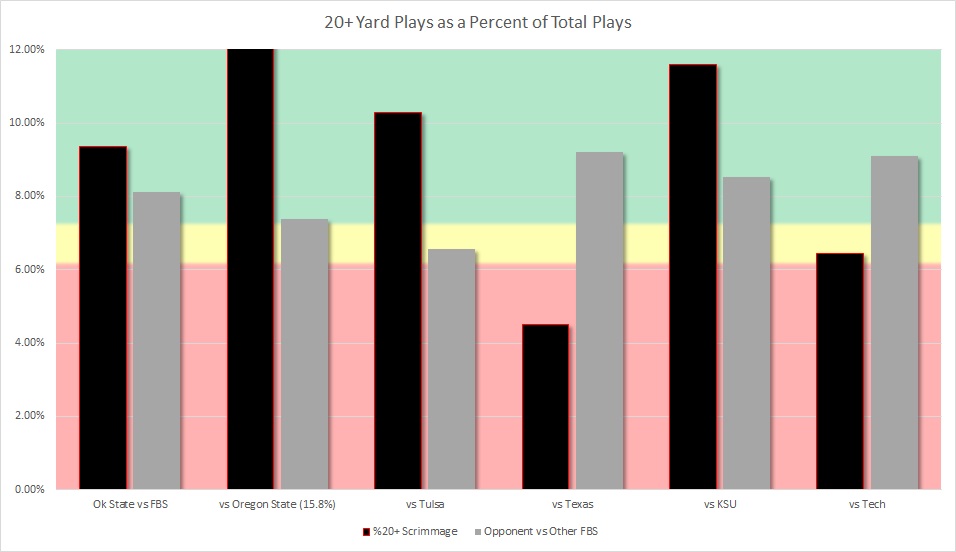
This team does a great job creating explosive plays of 20+ yards as you can see below. UT and to a lesser extent Texas Tech did a decent job limiting that but everyone else has seen them break big plays.
Offensive Passing Game
In the air the Cowboys complete a high percentage of passes but have had an issue with interceptions. Their yards per completion is lower which is more of a byproduct of how teams have schemed over the top to try to deny big plays to Tylan Wallace. Most of the big plays they hit in the above chart were runs. The interception percentage is spiked by a three pick outing in Lubbock two weeks ago but they still had 5.7% and 7.4% against UT and KSU.
| Oklahoma State 2019 | Other FBS Teams vs P5 Opponents | |
| Completion % | 63.87% | 60.98% |
| Yds/Att | 7.68 | 8.19 |
| Yds/Comp | 12.03 | 13.43 |
| Yards/Pass Play Including Sacks | 6.51 | 7.38 |
| Sack % | 9.16% | 5.22% |
| Int % | 5.34% | 3.02% |
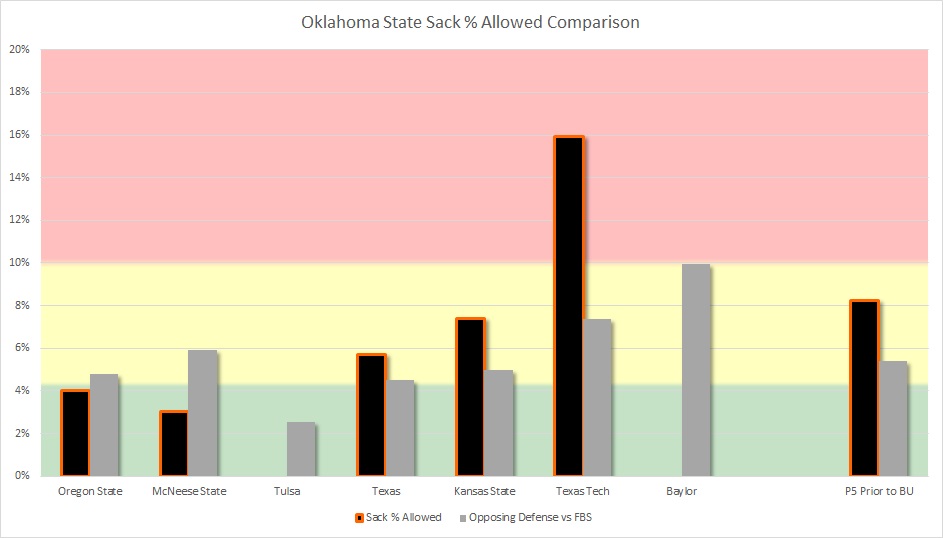
They haven’t had alarming raw sack numbers prior to Lubbock but the Cowboys have allowed a higher sack percentage than you would expect from each of the last three opponents with Lubbock being the first truly alarming output.
Offensive Run Game
OSU might be the most explosive running team in the country with arguably the best big play tailback and a capable runner at Quarterback. Their yards per carry are high across the board and they run it almost 60% of the time against P5 teams.
| Oklahoma State 2019 | Other FBS Teams vs P5 Opponents | |
| Yards/Rush | 5.63 | 4.51 |
| Yards/Non-Sack Carry | 6.28 | 5.13 |
| QB Non-Sack YPC | 7.58 | 6.03 |
| Non-QB YPC | 5.92 | 4.92 |
| Run Play % | 59.94% | 49.9% |
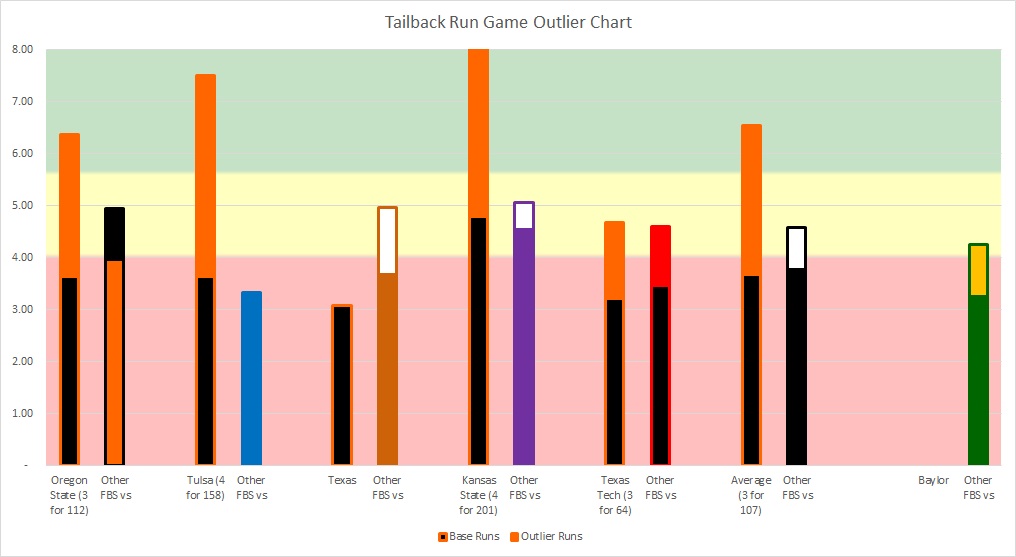
OSU is also one of the most explosive teams on the ground. When you omit kneeldowns, wide receiver carries, and QB carries their tailbacks get a lot of yards on outlier runs of 20+ yards. They will sputter on most of their other carries and then break a defense’s back with a long run from Hubbard. They average 3 of those runs for 111 yards against FBS teams.
Below is a chart showing how much of their yards per carry comes on outlier runs and how much they average without those. For comparison I have also shown what their FBS opponents typically give up. You can do a great job limiting him all day and then he takes a small opening to the house. I could probably have named this the Chuba Hubbard impact chart.
Defense
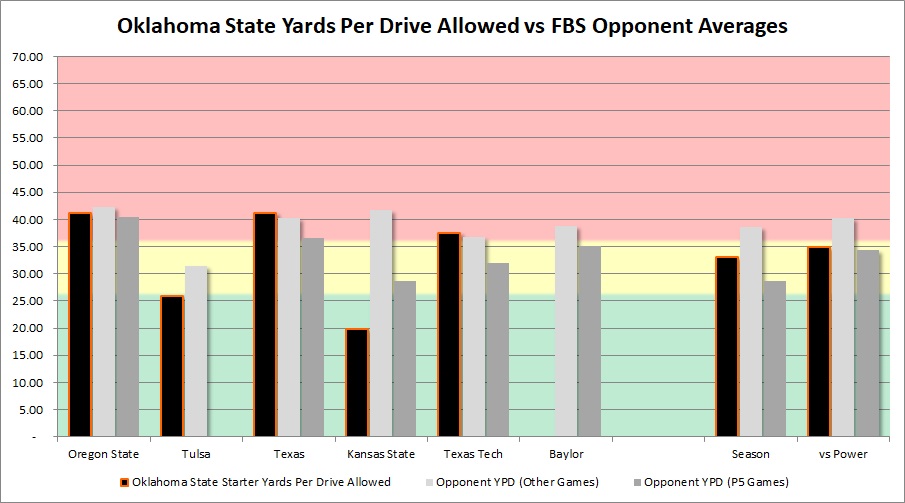
Defensively OSU is up and down. They did a great job against KSU and Tulsa only to struggle in the other three games. Which is the exception and which is the norm? We are about to find out in the next few weeks as they get Baylor and ISU next.
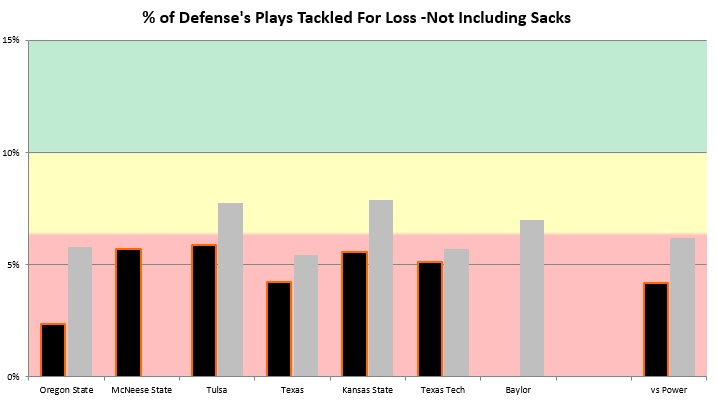
One issue that this defense has is that they really haven’t hit opponents for many negative yardage plays. Below you can see their tackle for loss percentage lags behind what other opponents do to their schedule.
Overall it’s a unit in progress that has some upside at key spots but a lot of youth in others.
Defensive Overview Stats
This defense hasn’t had great summary numbers here but has also faced some solid offenses that aren’t far off. They might not be the unit these numbers suggest.
| Oklahoma State 2019 | Other FBS Teams vs P5 Opponents | |
| Yards Per Drive | 34.9 | 36.84 |
| Points Per Red Zone Trip | 5.56 | 5.43 |
| Turnovers Per Game | 1 | 0.85 |
| Yards Per Play | 6.1 | 5.67 |
| Yards Per Game | 444 | 409.31 |
| % Of Drives Scored | 43% | 43% |
| 3rd Down % | 40% | 43.67% |
Defensive Passing Game
In the air they offer more single coverage than many teams Baylor will face and accordingly you see lower completion percentages and higher yards per attempt and completion as that tends to be the trend you see with that. However they also struggle with interceptions and sacks.
| Oklahoma State 2019 | Other FBS Teams vs P5 Opponents | |
| Completion % | 57.64% | 63.35% |
| Yds/Att | 7.67 | 6.96 |
| Yds/Comp | 13.3 | 10.98 |
| Yards/Pass Play Including Sacks | 7.39 | 6.11 |
| Sack % | 2.04% | 6.82% |
| Int % | 0.68% | 1.35% |
This pass rush has struggled to replace the veterans from last year. Here you see their sack percentage (sacks divided by total sacks or attempts) compared to what their opponents averaged against other FBS squads. The notable exception to the FBS qualifier here is McNeese who I simply gave the numbers for their other games.
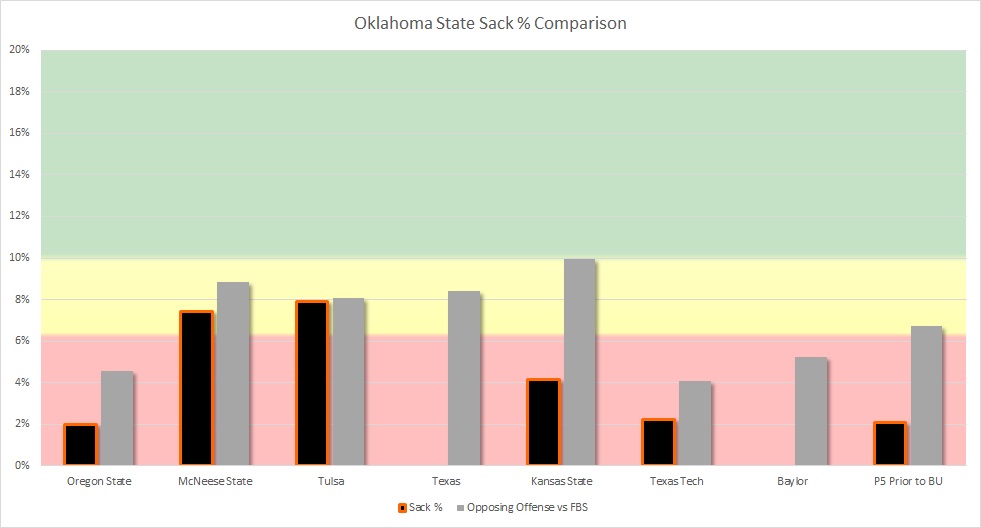
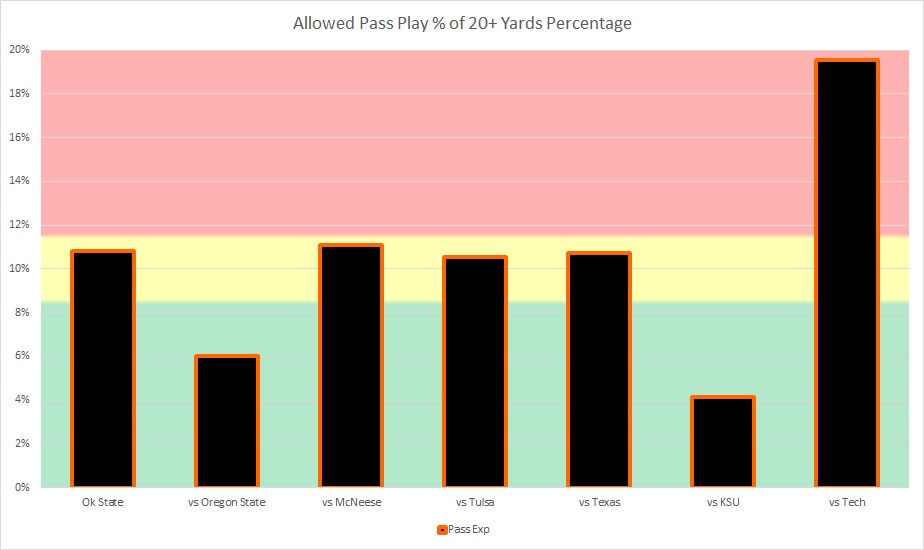
The pass defense for OSU is a big issue for them so far in 2019. Their secondary is arguably their strength personnel wise but due to youth up front they aren’t getting much help here. This has led to an average or bad explosive play percentage in the air against all but two opponents. Texas Tech had an outstanding effort against them.
Defensive Run Game
Against the run the OSU Cowboys have been pretty solid statistically. The numbers here look good but I can’t help but think that the passing stats are an issue because they commit more resources against the run.
| Oklahoma State 2019 | Other FBS Teams vs P5 Opponents | |
| Yards/Rush | 4.57 | 4.45 |
| Yards/Non-Sack Carry | 4.78 | 5.19 |
| QB Non-Sack YPC | 5.1 | 5.39 |
| Non-QB YPC | 5.01 | 5.25 |
| Run Play % | 49.48% | 47.74% |
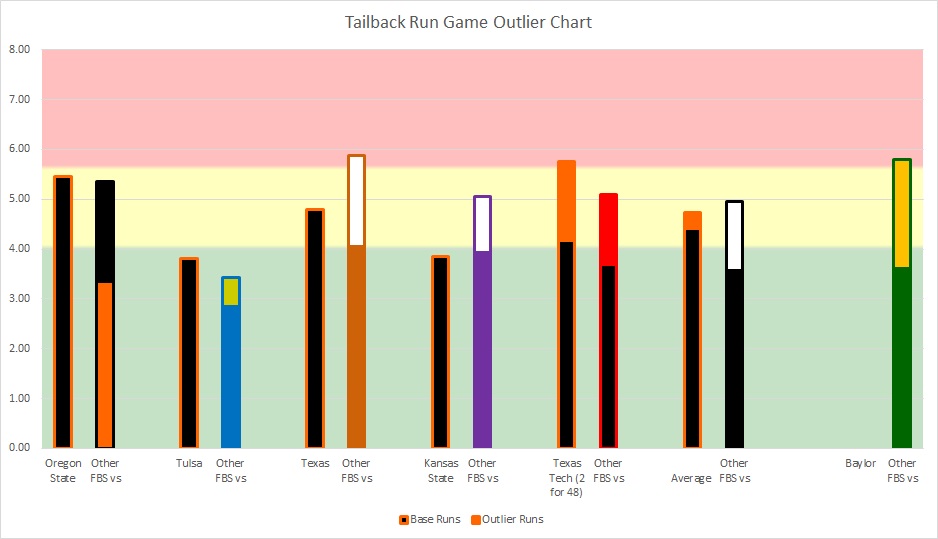
Below you can see they do a good job limiting the long run but their typical carries aren’t being limited as well as some other teams do against their schedule. Based on this I would expect teams to run more consistently on the Pokes but big plays will likely need to come in the air unless they break tendency schematically.
Return Game
In the kicking game OSU hasn’t been very dynamic returning the ball but they’ve done a solid job preventing the opponent from doing so. They average worse starting field position than their opposition but do a better job than others who faced their opponents.
| Oklahoma State 2019 | Other FBS Teams vs P5 Opponents | |
| Kick Return Average | 19.43 | 22.89 |
| Punt Return Average | 3 | 4.72 |
| Opponent Kick Return Average | 23.33 | 23.92 |
| Opponent Punt Return Average | -2 | 6.68 |
| Average Field Position | 70.26 | 72.63 |
| Opponent Average Field Position | 69.06 | 69.36 |
Conclusion
OSU is a team that will provide a very explosive offense that can really threaten teams. Hubbard and Wallace are dynamic and can really take over a game if you let them. They have their issues defensively and in turnover margin but will be more than a challenge for an injury riddled Baylor team looking to stay unbeaten.
Follow @Baylor_S11 on Twitter!
