Baylor has started off 8-0 coming into the home stretch of their season. How well have the Bears performed statistically?
Offense
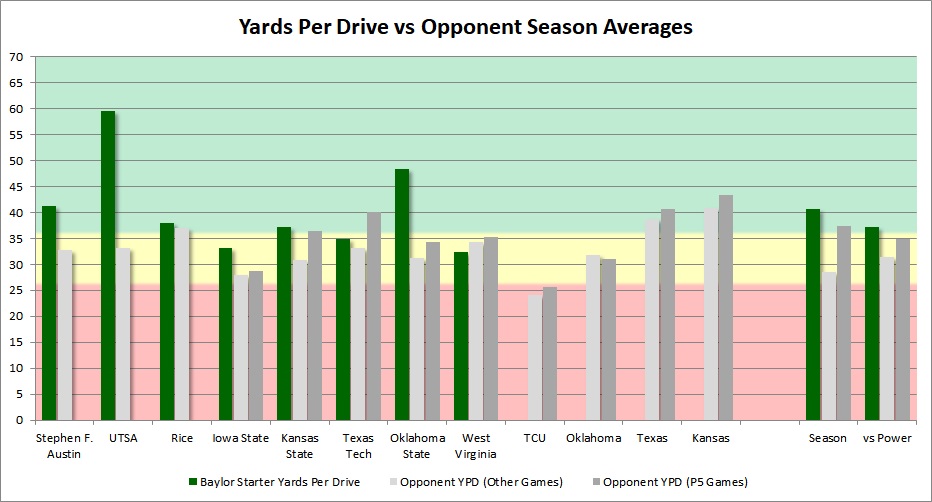
The Baylor offense has typically been slightly more productive per-drive than their opponent usually is used to giving up. There hasn’t been a “bad” outing in yards per drive although the West Virginia game and Texas Tech game were below par. The Oklahoma State performance was probably the most impressive relative to other games the opponent played.
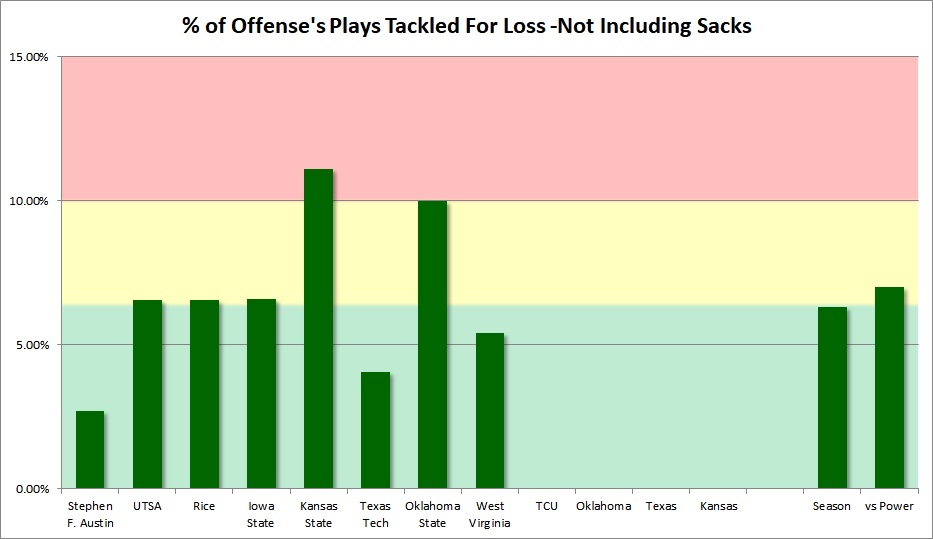
They also do a solid job avoiding tackles for loss when sacks aren’t included. The run game isn’t losing yards very frequently.
Offensive Overview Stats
Baylor’s big issues so far have been red zone efficiency and third downs. Third downs are surprising given how good the 2018 Bears were at it. However each of the remaining stats are solid.
| Baylor 2019 vs Big 12 Opponents | Other Power 5 Teams vs Big 12 Opponents | |
| Yards Per Drive | 37.19 | 34.95 |
| Points Per Red Zone Trip | 4.4 | 5.6 |
| Turnovers Per Game | 1.2 | 1.44 |
| Yards Per Play | 6.79 | 6.18 |
| Yards Per Game | 470.2 | 436.24 |
| % Of Drives Scored | 40% | 41% |
| 3rd Down % | 33.33% | 40.69% |
Offensive Passing Game
In the air the Bears do a good job completing passes, getting better than expected yards, and avoiding interceptions.
| Baylor 2019 vs Big 12 Opponents | Other Power 5 Teams vs Big 12 Opponents | |
| Completion % | 65.33% | 63.16% |
| Yds/Att | 10.11 | 7.85 |
| Yds/Comp | 15.47 | 12.43 |
| Yards/Pass Play Including Sacks | 8.36 | 7.1 |
| Sack % | 10.71% | 5.33% |
| Int % | 1.79% | 2.6% |
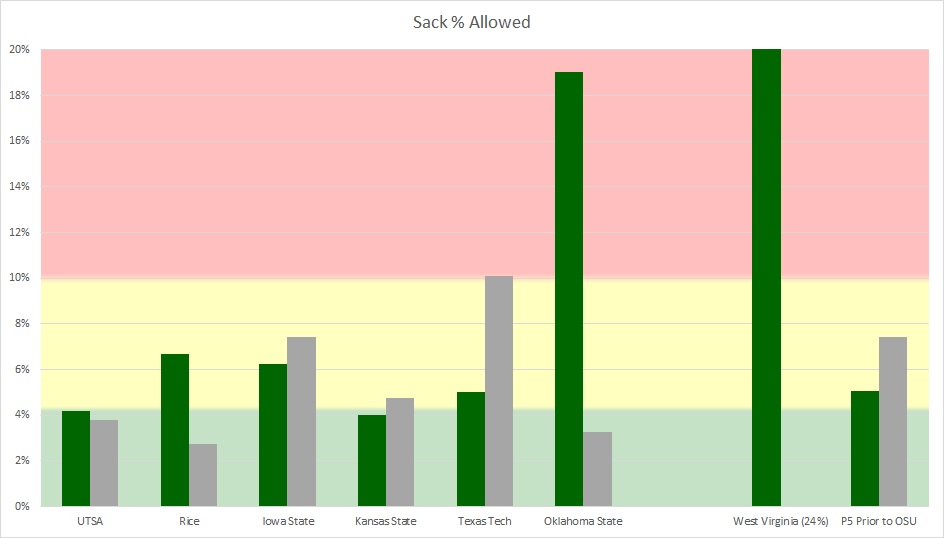
Pass protection has been a massive issue the last two games and the last two games have spiked the sack percentage allowed. Based on how extreme these outliers are I assume it’s a correctable issue but time will tell if it’s the exception or the rule.
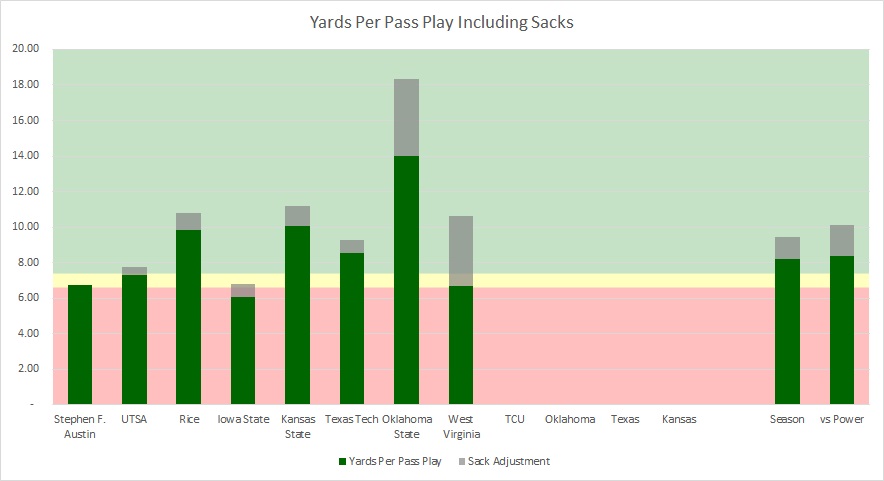
In spite of these sacks the passing game has been really productive as you can see here. Even the sack adjusted yards per attempt is high and the unadjusted numbers are really high.
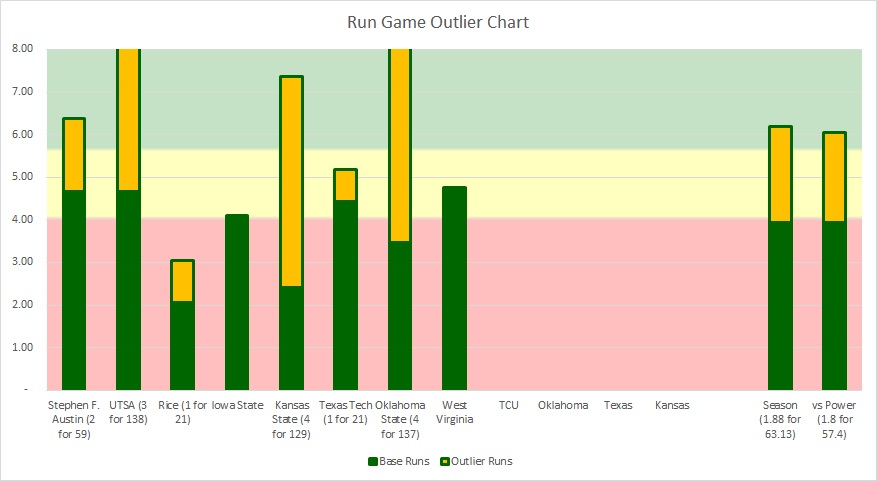
Offensive Run Game
This running game has it’s moments but isn’t dominant yet. Reshuffling the line to redshirt guys and the loss of Galvin has hurt this unit but the yards per non-sack carry is solid. However the non-QB carries could be better.
| Baylor 2019 vs Big 12 Opponents | Other Power 5 Teams vs Big 12 Opponents | |
| Yards/Rush | 4.26 | 4.69 |
| Yards/Non-Sack Carry | 5.31 | 5.26 |
| QB Non-Sack YPC | 7.61 | 6.37 |
| Non-QB YPC | 4.69 | 5.1 |
| Run Play % | 51.45% | 50.39% |
The offense has been borderline decent at getting tailback yards not including outlier runs. It’s got work to do but it’s a start for the multi-year process to build from. (*WVU numbers omit final three carries that were de-facto kneeldowns)
Defense
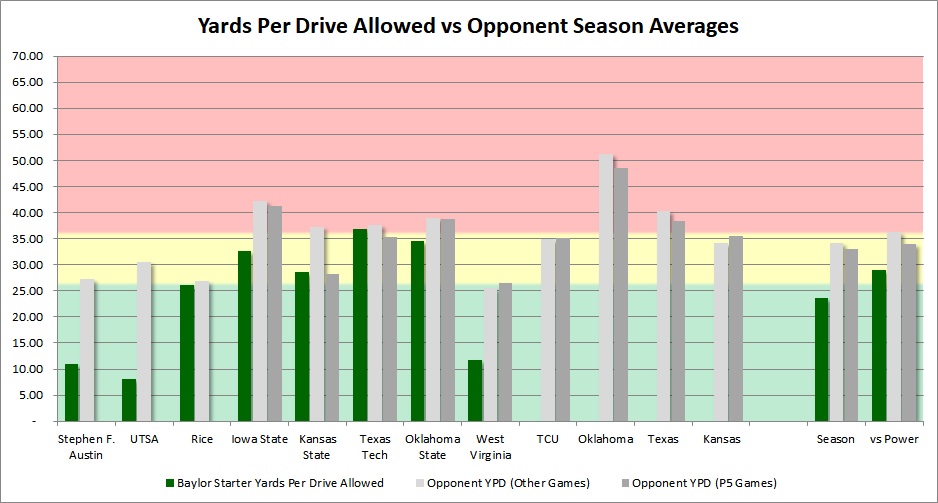
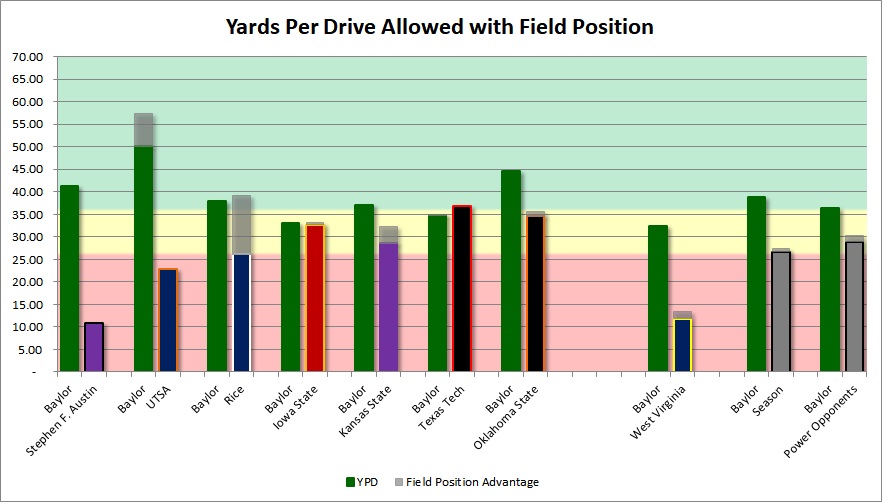
The defense is the obvious strength of the team and has done well. They hold power five teams to 85% of what other P5 teams have per drive. (5.07 yards fewer) The WVU game was outstanding outside of one play (6.3 yards per drive other than that drive) and the Texas Tech game was arguably the worst.
Defensive Overview Stats
The defense does well on yards, red zone points, turnovers, and on percent of drives scored. They are merely average compared to their schedule on third down so far and need to improve.
| Baylor 2019 vs Big 12 Opponents | Other Power 5 Teams vs Big 12 Opponents | |
| Yards Per Drive | 28.91 | 33.98 |
| Points Per Red Zone Trip | 4.59 | 5.33 |
| Turnovers Per Game | 2.4 | 1.22 |
| Yards Per Play | 5.08 | 5.8 |
| Yards Per Game | 388.8 | 401.39 |
| % Of Drives Scored | 26% | 40% |
| 3rd Down % | 35.71% | 34.9% |
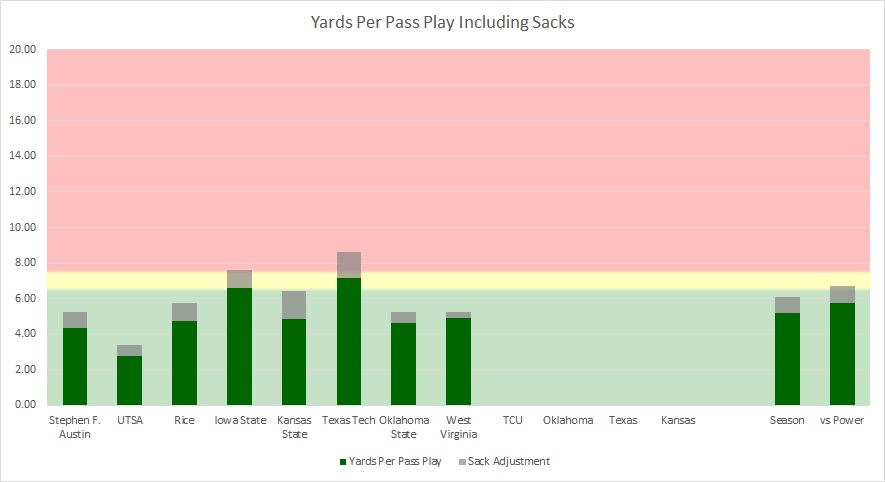
Defensive Passing Game
The pass defense allows a lot of completions with it’s “bend but don’t break” philosopy but does a good job with yardage, sacks, and interceptions.
| Baylor 2019 vs Big 12 Opponents | Other Power 5 Teams vs Big 12 Opponents | |
| Completion % | 62.24% | 63.33% |
| Yds/Att | 6.71 | 7.22 |
| Yds/Comp | 10.78 | 11.4 |
| Yards/Pass Play Including Sacks | 5.72 | 6.65 |
| Sack % | 7.98% | 4.35% |
| Int % | 2.82% | 2.6% |
Below you see a good look at it. When you include sack yardage only Texas Tech had an average performance.
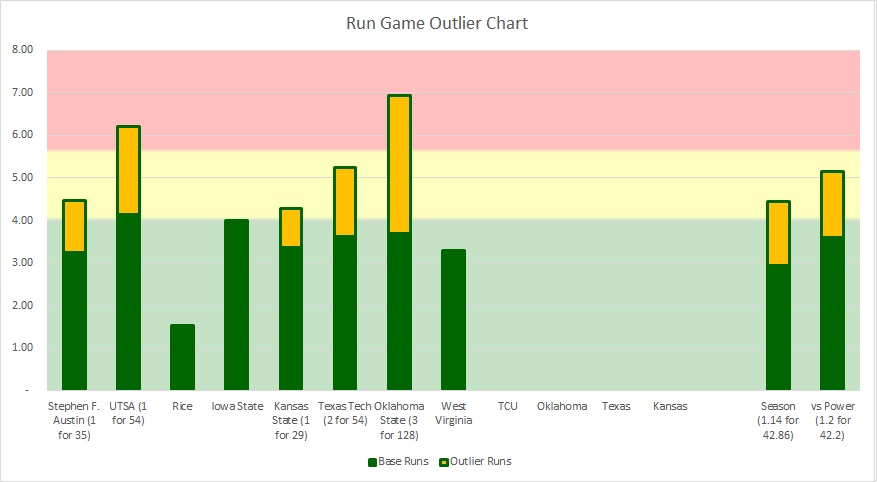
Defensive Run Game
On the ground Baylor has done a remarkable job. They do really well on non-sack yards per carry and have been on par with expectations in non-QB carries. The reason this is impressive is based on how much Baylor plays with very few defenders in the box. When you are voluntarily outnumbered and they can’t run you off the field it’s impressive.
| Baylor 2019 vs Big 12 Opponents | Other Power 5 Teams vs Big 12 Opponents | |
| Yards/Rush | 3.36 | 4.5 |
| Yards/Non-Sack Carry | 4.26 | 4.96 |
| QB Non-Sack YPC | 3.64 | 6.02 |
| Non-QB YPC | 4.92 | 4.93 |
| Run Play % | 44.39% | 49.98% |
Outliers have been a big issue in the Texas Tech and OSU games but otherwise you have a couple long runs late in non-P5 blowout games. Baylor has been effective limiting tailbacks but three solid running games loom on the horizon.
Explosive Plays
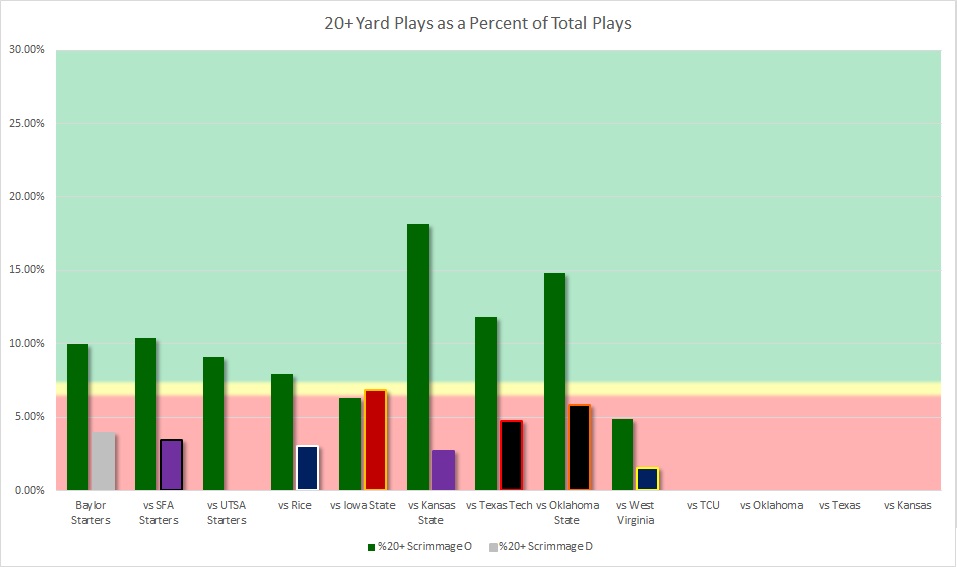
Baylor has been outstanding on explosive play differential. They have been ahead on explosive percentage in every game except ISU where they had the same number of explosive plays on 6 more plays which is close to a wash. Most weeks it’s a drastic advantage.
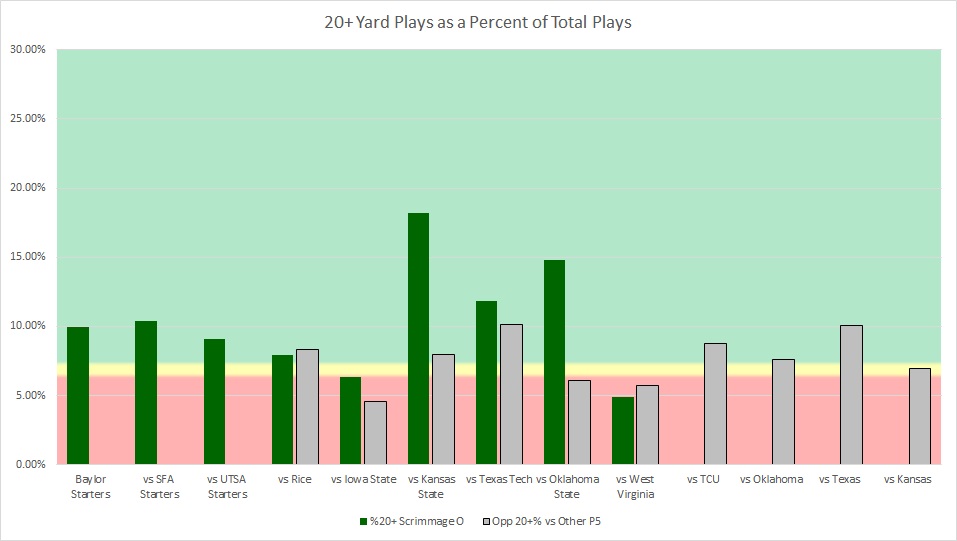
The Baylor offense has been really explosive outside of the ISU and WVU games and they are the best anti-explosion units Baylor will face. Frankly the ISU game was above what they usually give up anyway. Baylor’s ability to hit the big play is a huge factor and should be visible against four final opponents with average to bad track records limiting explosive plays.
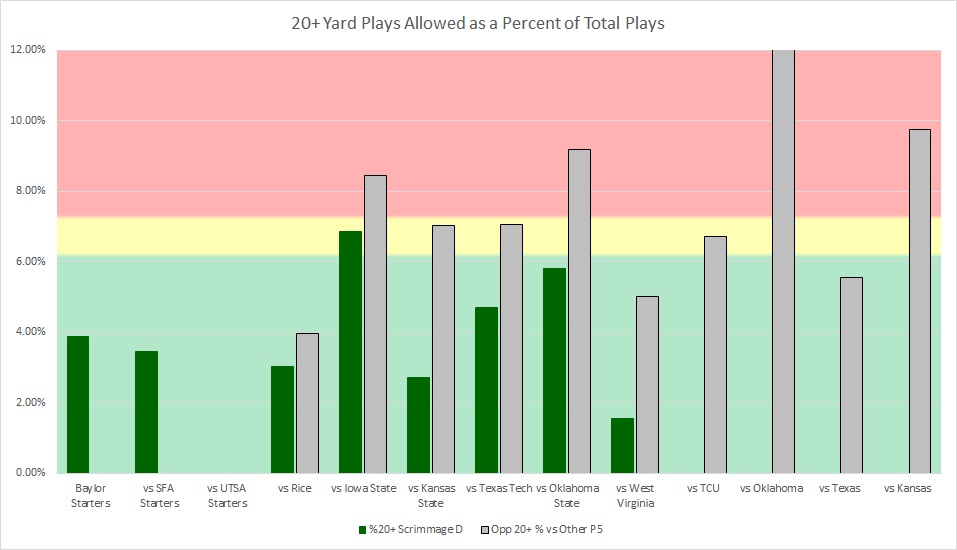
Defensively Baylor has done very well limiting them. The only ”average” performance was holding ISU well below their usual output. Three very explosive opponents will challenge this metric soon but it’s a great start so far. Oklahoma especially as they average explosive plays on 13% of their snaps. It’s even better when you look at how some of those plays happened.
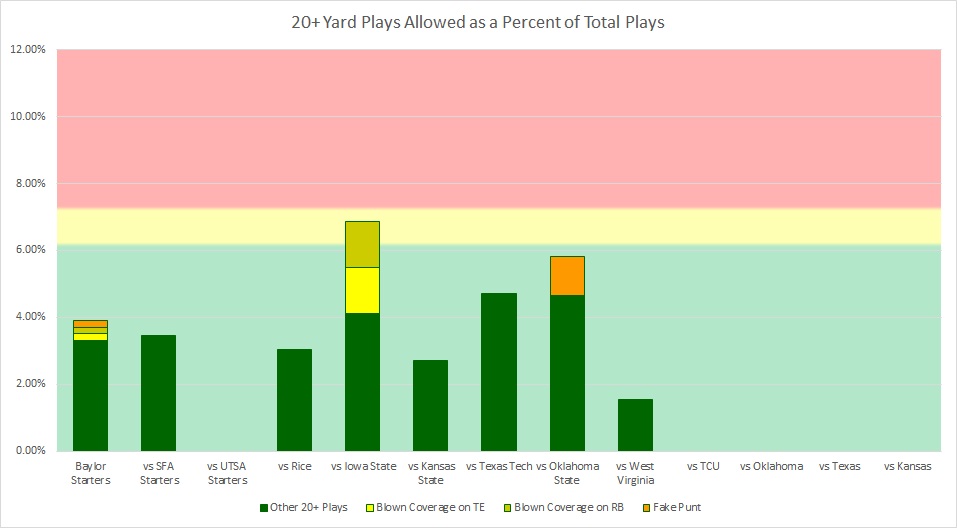
A fake punt and two blown coverages make up a sizeable share of that percentage. Baylor needed to make those plays but this does show that they aren’t getting beaten deep very often.
Return Game
This team hasn’t really done much in punt return but has been better than par in kickoff returns. Coverage units were pretty standard and are really helped by Baylor getting touchbacks. If Rauschenberg can return that will help a lot.
| Baylor 2019 vs Big 12 Opponents | Other Power 5 Teams vs Big 12 Opponents | |
| Kick Return Average | 23.13 | 19 |
| Punt Return Average | -0.2 | 4.82 |
| Opponent Kick Return Average | 21.82 | 21.13 |
| Opponent Punt Return Average | 10.33 | 7.01 |
| Average Field Position | 72.13 | 72.3 |
| Opponent Average Field Position | 70.73 | 70.16 |
Conclusion
This team has beaten several solid teams to get to 8-0 but has four tough games left prior to a potential date in the Big 12 title game and the bowl game. They have some issues that you hope that getting players back in the lineup will help but also aren’t a fluke. This team plays outstanding defense, throws it efficiently, wins the turnover battle, and wins the explosive play differential. The challenge is to keep going 1-0 each week.
Follow @Baylor_S11 on Twitter!