
Thorough analysis and a good read. It's going to be interesting to see how realignment unfolds. It appears from general public perception and the data/information Brian displays that the Big 12 has the advantage. I'm thankful Baylor is in the Big 12.
Photo by Jack Mackenzie - SicEm365
When realignment strikes, people tend to throw out television numbers to justify their opinions. But truthfully, many claims are not supported by the data. Even if the author does a good faith effort, the flaws in their methodology can derail the effort. It isn’t rare for sportswriters get caught in this whether they intend to or not.
In Stewart Mandel’s article in the Athletic breaking down television ratings for the Big 12 and Pac 12 he makes some basic mistakes that invalidate his conclusions. So let’s add context and get to the real picture by looking at what comparable data says.
Mandel’s Key Points
- Losing UCLA/USC isn’t as big of a blow as losing UT or OU. This point I agree on.
- He makes a ranking of schools based off only home games not involving the departing schools and averaging all games available under his assumptions on ABC, FOX, ESPN, ESPN2, ESPNU and FS1.
- He claims the Big 12 schools are behind the top six of the Pac 12 and all but two Pac 12 schools are ahead of six out of the remaining eight.
- He then credits the late time slot games frequently called “Pac 12 After Dark” as the reason for success in getting a higher number in his sample.
- He then claims the Pac 12 would not be in a weaker position than the Big 12.
Before I get to a quick list of the areas where his methodology is way off, I want to take a moment and mention that I agree that losing USC and UCLA isn’t as big of a ratings hit as losing Texas and OU. However, I would assert that the ten team Big 12 outperformed the Pac 12 over the last decade head to head.
When you sample an even number of games per school instead of just a simple average you end up with 2.2M per game vs 1.7M from 2013-2021. Additionally, if you simply look at how teams performed on ABC/ESPN/FOX/FS1 in the same time & day windows on a given network, the Big 12 wins the comparison under the prior configurations pretty solidly for a typical Saturday that isn’t an unusual week like Championship week or Labor Day week for example.
Of the TV window averages on ABC, FOX, ESPN or FS1, where it was a conference game not on Championship Week or Thanksgiving Week, the Big 12 had the advantage in seven of the nine by an average of 30% in each window and lost two windows by 5% and 10%. The two losses, 2014 USC-Stanford and 2013 Stanford vs Oregon, are outliers that are 2-4 times higher than the rest of the games averaged. Drop the top performer from both leagues in every time slot and the Big 12 averages more in all nine windows comfortably under the old configuration.
When you look at championship weekend the Big 12 title game dramatically overperformed the Pac 12 title game and even non-title games for the Big 12 from 2013-2015 in the same windows compared well. Looking across common TV windows on Championship weekend or Black Friday, the Big 12 won these comparisons by an average of around 30%. So while it’s a bigger hit, the Big 12 was ahead to begin with.
There are many errors that invalidate his conclusions. Even if some of them end up in the ballpark accidentally, it’s still building on a weak foundation. Let’s take on some of the glaring issues.
Network Differences
The network you appear on determines a lot. Mandel gave lip service to how the high number of FS1 games artificially disadvantages the Big 12 due to games involving Texas and OU taking up most of the best network spots. However, his analysis otherwise disregards this massively significant factor. Look at the following chart for median values from my data for each time slot on a typical Saturday.
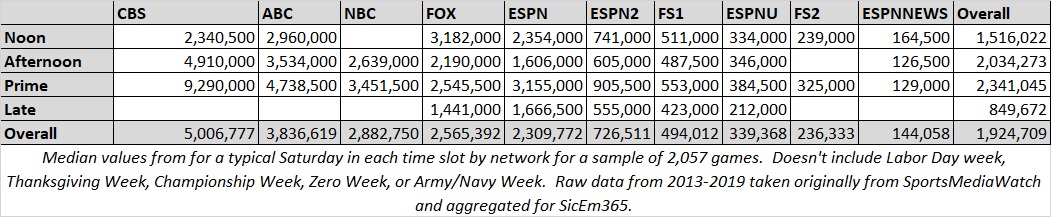
The expected value for a game on FS1 in the afternoon is almost 10 times less than a prime time ABC spot. Frankly FS1, ESPNU, ESPN News and FS2 games will tank your averages if you are a Power 5 conference. ESPN2 is slightly better but still not very strong as it’s top window in prime time has a median value of under 1M.
Given that his sample has only 28% of the Pac 12’s games on those weaker networks and 45% of the Big 12’s games the comparison is apples and oranges already. His sample for the Big 12 gives the league around 12 appearances on ABC/ESPN/FOX/ESPN2 per year, less than the 20 minimum the AAC (a league with much less draw than the new Big 12) contract calls for on ABC/ESPN/ESPN2.
Additionally, the AAC had 27 actual appearances on those in 2021 and given that the Big 12 swiped their top 3 properties and took in BYU who’s independent contract had 3 minimum and typically got 4-5 per year in practice it’s unlikely to be as low as the sample used when they strike a new deal. This figures to be true even if the B1G and SEC take more top spots the Big 12 and Pac 12 used to get. The Big 12 had 31 on these networks when not excluding UT and OU in 2021 with 22 on ABC or FOX.
Assuming 8 league games in the new SEC they’ll add 8 conference games and probably 6 non-conference games to the SEC inventory.
Specific TV Network Window Comparisons - Apples to Apples
Accounting for the network or TV window is a better way to go about this. The Big 12 and Pac 12 due to geography and the PAC’s willingness to play more games on Thursday and Friday don’t overlap as often as the Big 12 does with the SEC or Big Ten. However let’s take a closer look at the times where they were on the same network, on the same day of the week, and on the same time slot. Ideally I would have time to do more advanced calculations (and will try to do so in a future article) but in the interest of a quicker result we’ll go with a limited sample where they overlap.
Below is a comparison of what happened when each played a conference game that was on in the following time slots they have in common on a typical Saturday window. Then below I include some comparisons on some of the bigger Thanksgiving week and Championship week windows where they also overlapped. The Big 12 wins every window on ABC, ESPN, or FOX on a traditional Saturday except the ABC prime time window where a massive 8.7M Stanford-Oregon 2012 game tips it to the PAC where otherwise the average would be 3.9M. The Pac 12 also wins the Saturday FS1 windows where the Big 12 shoving twice as many of their worst games dips the averages. The Big 12’s top 12 or 5 games in each of those FS1 Saturday windows exceeds the PAC averages.
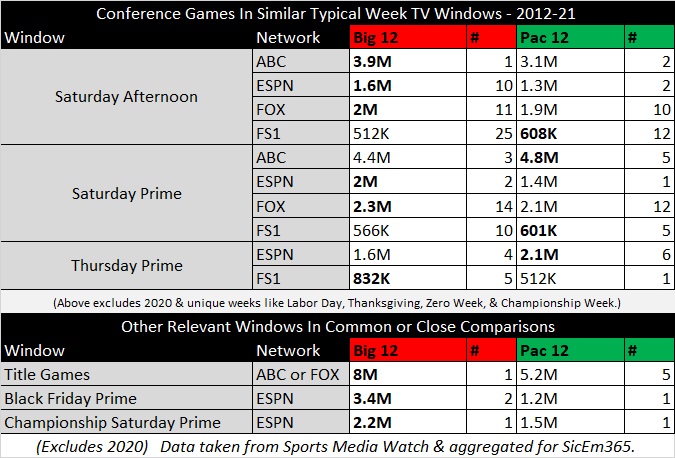
The Thursday game between Oregon & Stanford in 2013 went for 5.7M but without it the Pac 12’s games averaged 1.36M which is similar to the Big 12’s average of 1.4M without TCU-Tech 2013. (2.3M) Without Baylor-KSU 2015 the Big 12’s FS1 Thursday number drops to 743K.
The next group is games on Black Friday or Championship Saturday- windows with less competition for the league title games or Black Friday but that ESPN Prime window on Championship Saturday was usually is going against both the Big Ten and ACC title games. The 2021 Big 12 title game blows away any P12 title game on ABC or FOX. Even if you averaged in the relatively unopposed noon ABC matchup for TCU in 2014 against a 2-10 ISU team where they drew 4 million, the Big 12 wins the comparison. On Black Friday the 2015 Baylor-TCU game’s 5.1 million blows away the 2021 Apple Cup but 2016 Baylor-Tech where Baylor was .500 and Tech didn’t go to a bowl wins head to head with almost 1.8M.
Taking a closer visual look specifically at the ABC, FOX, and ESPN windows the following bar chart shows how each league did on each network within the windows they both appeared in. I have also compared the Pac 12 title game that broadcast in a Saturday window on ESPN during championship week against Baylor’s 2014 matchup against KSU in the same spot which technically was not a title game.
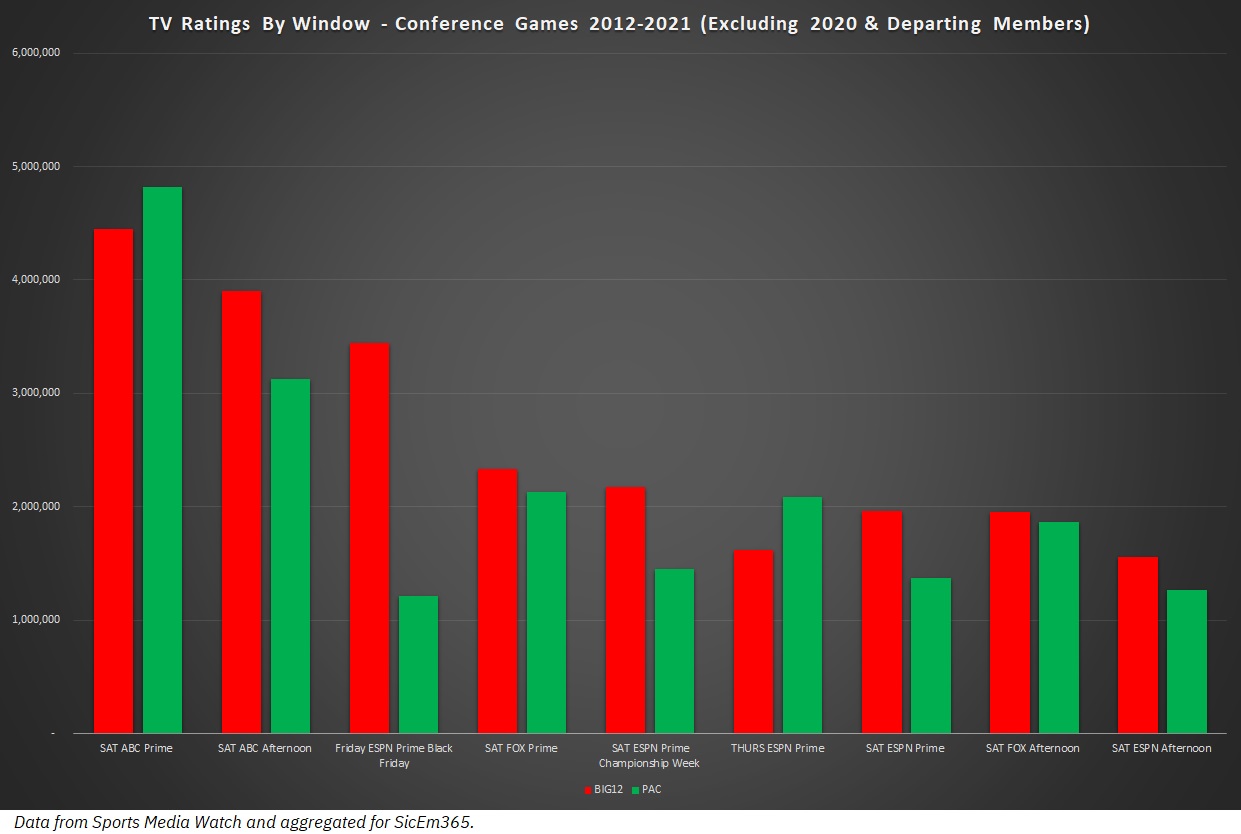
The Big 12 wins most of these but it’s not the gap it had pre-realignment and both are within range of each other. The Big 12 started off stronger and the mutual departures simply brought them more even.
Remember the median values I posted above for each typical Saturday TV window? In my data every game is compared against that while also tracking specific windows on Labor Day Week, Championship Week, Zero Week, and others. Comparing each remaining group’s performance against expected values for their time slots we see that the Big 12 league games performed better in the common time slots. During it’s aggregate games in the afternoon or prime time windows the remaining Big 12 averaged around 1% more than expected while the Pac 12’s remaining schools averaged 5% under expectations. The Pac 12 does well (+15%) in the late window as the comparison points are mostly MWC schools who don’t draw on a P5 level except for Boise.
More Bottom Tier Games Reach Nationally Rated Networks
One of the other flaws with a simple average was that the samples aren’t similarly sized per-school. The top 52% of the PAC10’s non-USC/UCLA conference games reached nationally rated networks. Compared to 64% of the remaining Big 12’s without UT and OU. This means that the Big 12 has 4.25 games per league member annually and the PAC10 has 3.6. Why does this matter? Here’s a chart of the games in my data set to show you why.
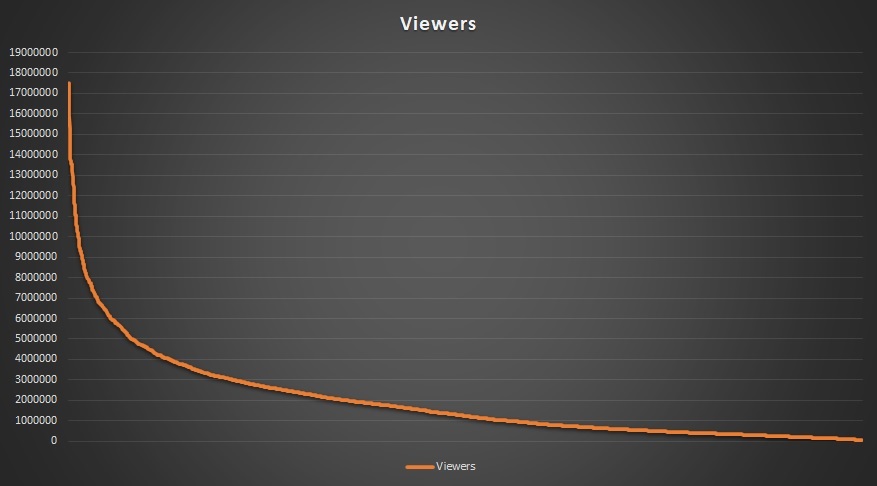
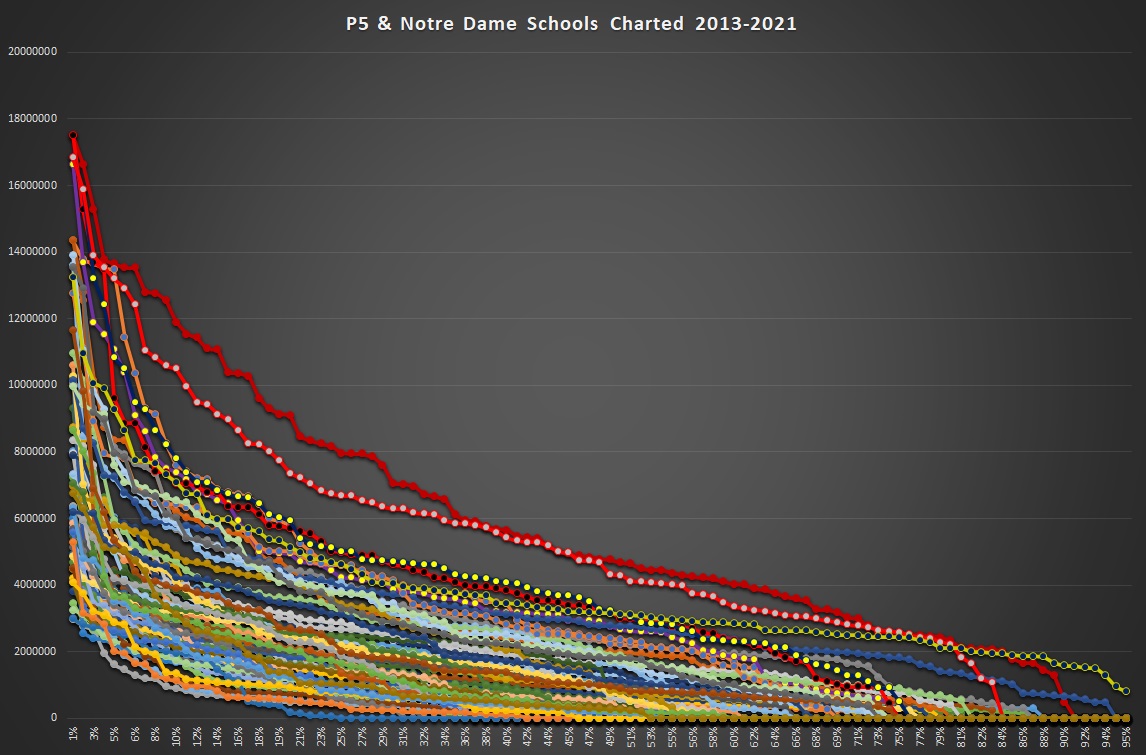
Basically the tv ratings in this data behave like a hockey stick as you go down a team’s or league’s schedule. The top games get a ton of viewers relative to basically anything else. The Big Ten and SEC raided these leagues to generate more of those games at the top of the hockey sticks or at least get more clearly on the left half of the chart. That’s where networks make their money. The more games you add, the more the average tanks. The pattern continues across basically everyone as this chart of all the P5 teams individually shows. Even the two Alabama and Ohio State trend lines above everyone else go down as you get to the less valuable games.
This is even true across networks as well. So as you get closer to the bottom half of your inventory you won’t keep up your better numbers. So equalizing the amount of games per school makes for a more accurate sample if comparison is your goal. It’s better to look at specific window comparisons but if you want a quick and dirty analysis... let’s at least account for sample size.
To use an absurd example to stress the point- if you used a simple average like Mandel’s analysis you would claim SEC doormat Vanderbilt outdrew Miami per broadcast in 2018. Not accounting for different sample sizes would lead to such an absurd conclusion looking at their 2018 games charted below.
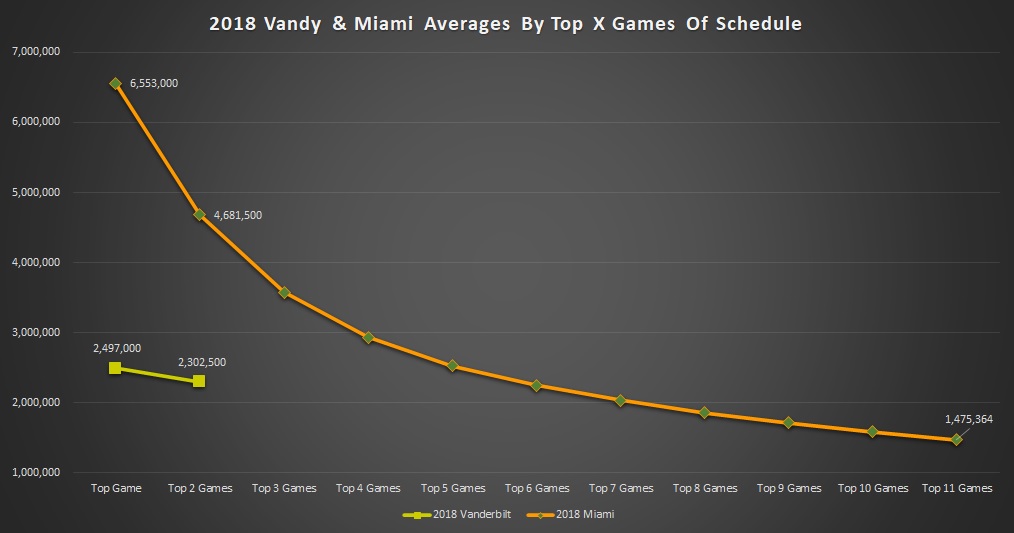
*Technically* Vanderbilt averages more per game than Miami for the 2018 season on nationally rated networks. However it’s an absurd technicality as their only nationally rated games were at Notre Dame and against Florida who are among the top ten or so brands in the sport. Miami’s top two games blow away Vandy’s inflated average but once the worst of the 11 games against the likes of Duke, Georgia Tech, Toledo, and FIU eventually tank the average you get an absurd conclusion that anyone with any knowledge of college football brands would laugh at if you said it to them. The reality is with the other ten games on the not rated SEC Network Vandy gets a higher average only because there isn’t any data to put into the average. It’s going to lead to bad conclusions if not accounted for. This is happening on a smaller scale in Mandel’s sample against the Big 12 and actually disadvantages both leagues when compared to the ACC who has even fewer games per-school make it to rated networks than any other P5.
One perfect example for the Big 12 and Pac 12 is the 2015 UTSA Roadrunners. They played at both Arizona and Oklahoma State 16 days apart. OSU’s average is brought down by a lesser opponent matchup having 563,000 viewers while Arizona’s average is inflated since not having data lets their average ignore a game that wasn’t going to go for much. That’s happening across a significant portion of the sample.
For instance the in both 2018 the Oregon State Beavers had 8 games of their schedule on non-rated networks, another game where data was unavailable (Nevada), and a game vs Ohio State to skew the raw average wildly! They technically averaged 1.6 million in 2018... in 3 games against USC, Oregon, and Ohio State. That is not representative of Oregon State. You could get similar numbers from a 3 game sample of teams from the low end of the G5 conferences against those three. If you take KU’s top 3 that year (UT, OU, WVU) they also average around 1.6M but since they don’t get to omit the weaker games from the average so their number ended up at 982k. That year for the Beavers (along with 2015 for Oregon State) could easily have been swapped for Vanderbilt in my example above.
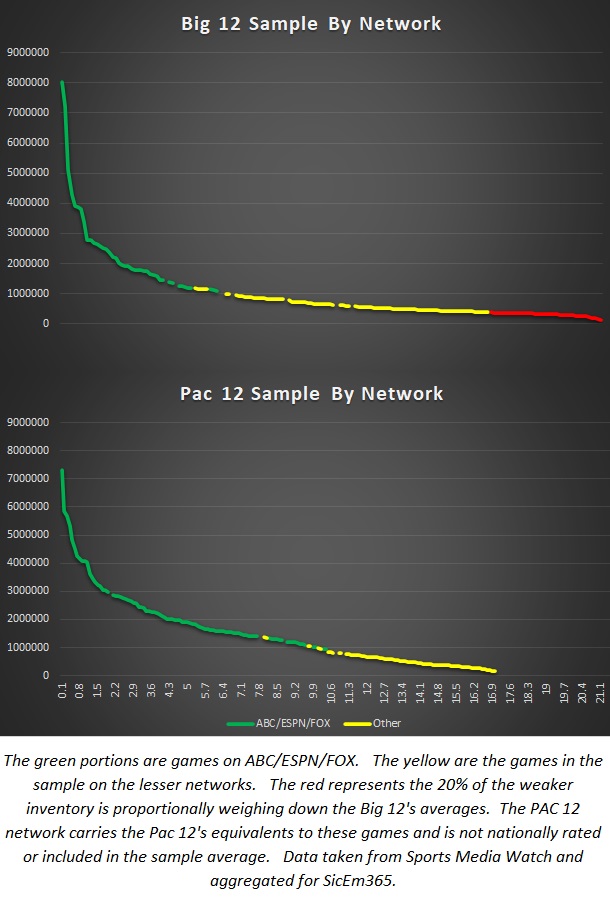
Below you see a combination of our first two issues overlayed in this chart. You see the green portions of the samples are games on ABC/ESPN/FOX. The yellow portions are games on FS1/ESPNU/ESPN2. The red are the games on FS1/ESPN2/ESPNU that drag the Big 12 average down that the PAC escapes with a technicality of having their counterparts broadcast on the Pac 12 network. So not only is more of the chart green but it also gets to omit the red portion. So both from a per-school sample size and from a network selection standpoint it’s already apples and oranges.
To get an even sample you need to equalize the sample sizes and try to end up with a similar percentage of games on similar networks or at least call out the differential. I have limited this sample to conference games excluding departing teams from 2013-2021 to get as even of a comparison as possible. This raw totals give the Big 12 schools 27.4 games per school and the Pac 12 18.3. Obviously this will skew the result if we went with a raw average.
Taking the top 146 games (18.3 * 8 rounded) for the Big 12 gets the both conferences to right around 1.4M with the Pac 12 slightly higher. These samples also had the Pac 12 with 9% more games on ABC/Fox/ESPN than the revised Big 12 sample giving them a little inflated advantage that would easily flip the lead to the Big 12 if accounted for.
Similarly if we expand the Pac 12’s sample to match the Big 12’s by estimating how some of their P12N games might rate on ESPNU or FS1 we get a similar conclusion. The Big 12 had 27.4 games per school and that means the Pac 12 needs to estimate 91 additional games. I chose to use ESPNU’s average for a Pac 12 conference game without USC and UCLA which is probably generous given how the matchups tend to be less valuable and the network is dramatically limited in reach.
The Pac 12 network had 14.8 million subscribers as of late 2020 according to reporting by Jon Wilner. According to the Sports Business Journal, Fox Sports 1 had 79.874 million in early 2020 and Outkick cited a source indicating that ESPNU is available in 54.9 million. It simply seems to be the closest comparison with data and is probably overrating the numbers significantly anyway given these tend to be weaker games and the Pac 12 network isn’t going to bring in casual viewers as well. The bottom half of the Pac 12’s 59 games on FS1 from 13-21 are pretty close to that ESPNU average as well.
As a result of this both leagues end up right around 1.06M with the Big 12 slightly higher and the Pac 12 having around 10% more of their equal sample games on the three bigger networks. Again it’s very close and even if you gave what I consider to be an extremely high estimate for these games (copy FS1’s 600k per game) you’d still only be at a comparable 1.1M where adjusting for the network differential could easily flip the lead back.
Either way go you get it really close to where you get into splitting hairs to differentiate the two.
Non-Conference Games Against Bigger Opponents
In addition to the above the Pac 12 benefited the years of Mandel’s sample having many more games that are hosting some of the 16 highest rated Power 5 teams in my data like Notre Dame, Texas, Texas A&M, Nebraska, Michigan, and Michigan State during the years Mandel sampled. When the Big 12 only had three of these with games against Ohio State, Arkansas, and Iowa over that time it’s another area where the numbers get skewed. Only Ohio State was in the top 16 average TV ratings in my data from 13-21 but all the Pac 12 opponents I listed were included. Arkansas and Iowa are just outside of the top 20.
These games can skew the data as nobody attributes Oregon State vs Ohio State getting lots of viewers to the Beavers who were coming off of a 1-11 season and would go on to post a 2-10 record or that the 2-10 2015 Beavers against Michigan was any different. These two games averaged almost 4 million which is a huge bump that isn’t really telling you about the program you’re trying to evaluate. It just tells you they happened to schedule more aggressively in a given time period.
Arriving At A Reasonable Ranking
Averaging games across networks and tv windows isn’t a very good way to do it and comparing schools with Z scores if time was permitting would be better. However in the interest of quickly coming up with something more sound than his list, we’ll attempt to improve on some obvious flaws.
Mandel not only ignores network, time slot, quality of non-conference competition, and sample sizes- he also arbitrarily counts just home games. I get that a conference sells the rights to it’s home games and not the road games probably inspired his decision. This ignores relevant data for evaluating how they’ll do going forward. It also leaves things unclear as to how major neutral site games get accounted for. Is Oregon-Auburn included for the PAC but TCU-Ohio State excluded from the Big 12 when both were played at AT&T Stadium? Who gets credit for KSU-Stanford 2021?
You need to look at as much relevant data as possible and you need to account for at least one of the major criteria I started the paragraph with. Below I will control for the number of appearances per school, limit it to conference games, and omit conference title games so that teams who qualify don’t get inflated relative to conference peers. It’s group A vs group B with an even sample of games and no group C to tip the scales. The points on the X axis are games per year. In this 9 year sample this means 1 game per year is averaging your top 9, 2 per year is the top 18, and so forth.
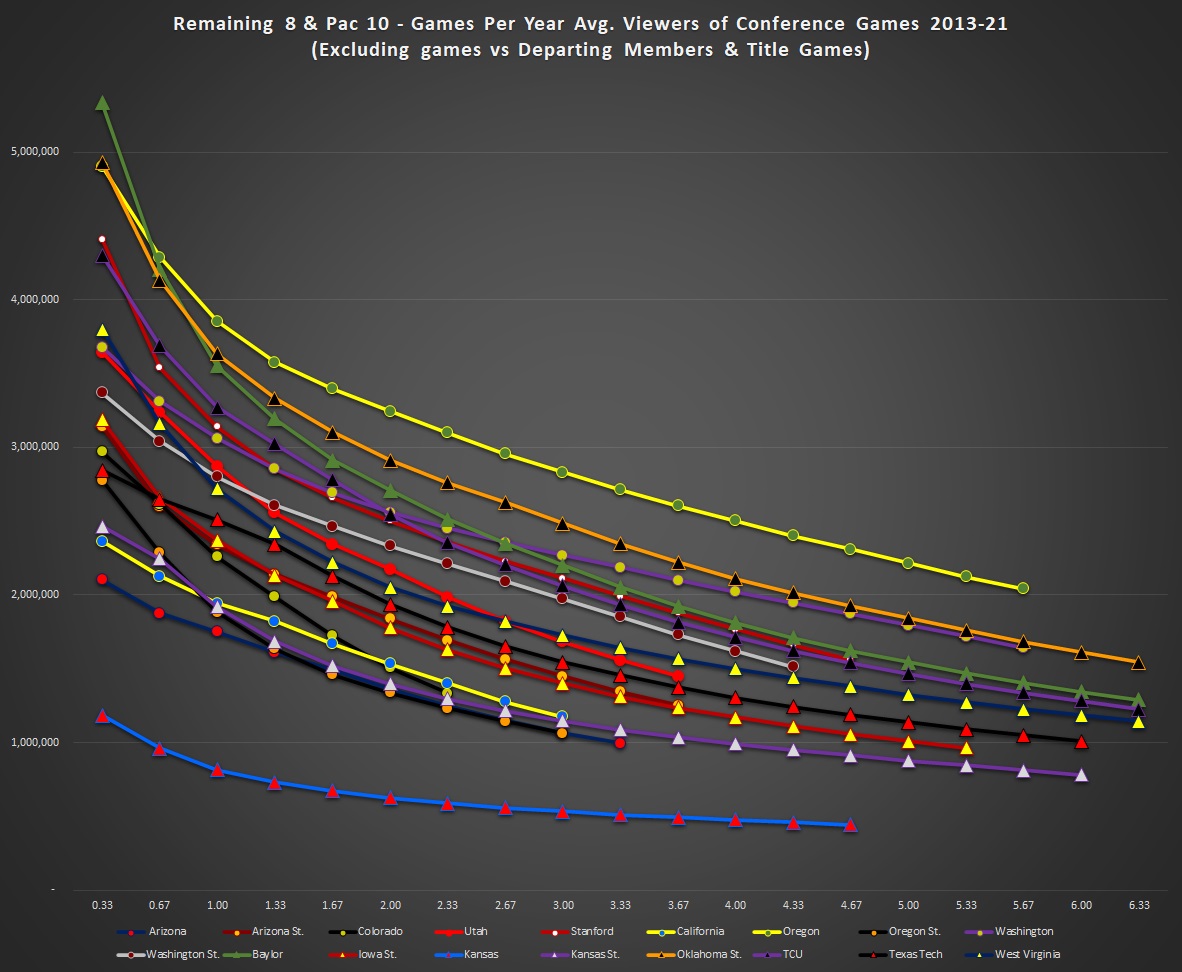
As you can see the ranking can vary depending on where you make the cutoff even if you compare like data points. Oregon State’s top data point (.33 per year or top 3 games) is above Kansas State’s but the Wildcats pull ahead by the time you get 3-4 points in and similarly we see Wazzu catch Utah as the sample gets deeper. Mandel’s averages effectively compare the far right numbers for the Big 12 with wherever the Pac 12 teams stop having games to average in. For instance Cal’s line ends at 3 games per school but all Big 12 teams except KU keeps going to over 5 games per school and some over 6. This is clearly apples to oranges since Cal wouldn’t come close to maintaining those averages if we were able to see the numbers from the Pac 12 network or if those games had appeared on one of the weaker rated networks like ESPNU or FS1. Additionally it warps the Iowa State & Arizona State comparison as those two track almost in lock step with each other until ASU runs out of games to average.
To create a clear ranking and having to pick one sample size to use I will choose to get the deepest data with similar sample sizes. I will limit the number of games to the smallest individual school sample (Colorado’s 23) and everyone’s top 23 will be compared rather than comparing 23 of CU’s to 60 of Baylor’s, 52 of Oregon’s, 45 of KU’s, and 29 of Cal’s. Let’s make it as even as possible while allowing for as many games as possible to smooth out distortions that outliers at the top might provide.
Below is how the 18 combined teams rank from 2013-21 with that sample.
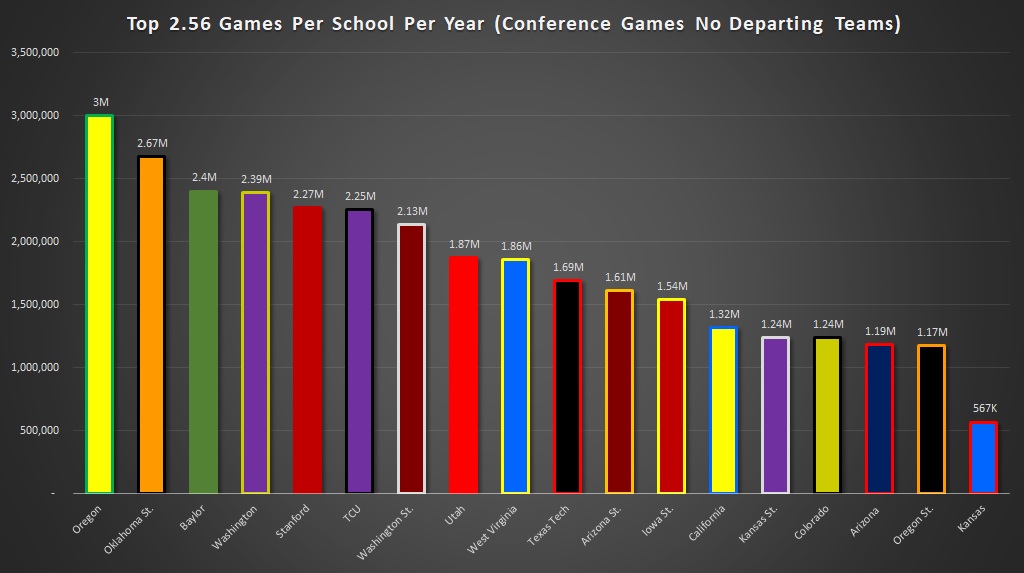
Oregon is out in front as most expect however Oklahoma State and Baylor are in spots 2 and 3 with Washington right behind them. TCU and Stanford are almost even as are WVU & Utah and ASU & ISU. Then everyone else is bunched up before Kansas comes in a distant last.
A flawed simple average has Cal’s inflated number ahead of Tech, ISU, and the Kansas schools but behind six Big 12 schools. That’s a far cry from claiming they beat out everyone but one as Mandel’s article claimed. To say his ranking was misleading is putting it mildly whether he intended it or not. I choose to think the best of people and assume it was an honest mistake with very flawed analysis.
The individual school comparison does fall in line with my other comparisons that these two conferences have produced at a similar television viewership level overall. Each has two of the top four, four of the next eight, and while KU is clearly last the Pac 12 has four of the bottom six.
Pac 12 After Dark Isn’t Why Mandel’s Numbers Favored The PAC
The differences in his numbers were mainly due to network, window, & sample size variances along with favorable home non-con games where the PAC 12 played more of the Big Ten and SEC heavyweights or Notre Dame at home than the Big 12 did. Of these only Stanford hosting Notre Dame figures to be ongoing with any frequency but then again Bedlam & Tech-UT figure to continue in some capacity and they don’t factor into the Big 12 side.
Additionally the Pac 10 teams in late windows wouldn’t vault teams up to the numbers Mandel reports. Doing my best to duplicate his assumptions in my data for what teams average in that late slot across all networks is either right around 1 million viewers. They average 1.6 on ESPN but that’s only half the sample of late games and ESPN2 is 656k, ESPNU is 248k, and FS1 averages 550k. Simply put that mathematically cannot vault 8 out of team teams to over 1.18 million and possibly significantly more when the late slot averages just barely over 1 million. It’s a nice thing to add into a contract negotiation and fills a need for broadcasters but it does not mathematically appear to be why those numbers went up in his sample.
A Raid Could Make Big 12 After Dark
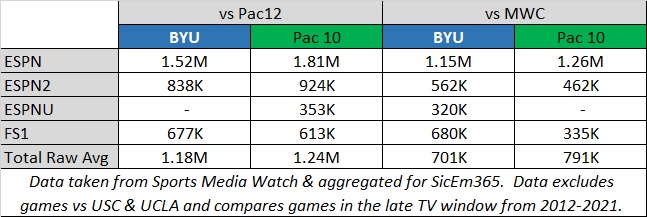
The Pac 12 schools have a niche with the Late TV window but they aren’t alone as both BYU and Boise State have done well when adjusted for competition in that window. New Big 12 member BYU averaged 3 “after dark” time slots in their ESPN contract since 2013 and performed pretty similarly to the Pac 12 during that time when the competition is similar.
There have been rumors in the media that the Big 12 and several schools from the Pac 12 may have been talking about joining the Big 12. Between the existing membership of BYU and a hypothetical raid, there’s potential for the Big 12 to essentially duplicate the advantage of Pac 12 after dark if expansion out west were to occur.
It would be a big asset as an expanded Big 12 would be able to fit into any TV window across the entire day with three members in the eastern time zone, eight in the central time zone, and BYU plus any additions out west.
How Do The New Four Compare?
Obviously UCF, Houston, and Cincinnati played lesser brands in the AAC than they would in either the Big 12 or Pac 12. Also as the top three tv properties in the AAC they got a lot of the tv appearances which actually gave them more appearances per school as a group than the Pac 12 has. This means that their averages have a lot of matchups vs the weaker portions of the AAC in them tanking the average to just under 750k in the 117 games that the we have data for where the three schools played teams that were conference mates at the time which includes Louisville & Rutgers in 2013 and UConn before 2020. This is obviously a much deeper per-school list than what the Pac 12 averages. The Pac 12 averages 18.3 conference games per school on their list as they have 183 games and ten remaining members.
So for a quick comparison let’s take the top 18.3 games per school that the Pac 12 had without their unopposed title game. The Pac 12 averaged just over 1.4M in their games.
How does the AAC trio do with a proportional sample? They averaged 1.29M against teams that were conference foes at the time. When you add in their 8 games against future conference mates in the future Big 12 their top 18.3 games per school average jumps to 1.36M not including the AAC title game.
Obviously adding the AAC title game into the mix would make for a huge boost but since I omitted the P12 title game I will keep it even.
BYU had no conference since 2011 so they are a bit tougher to evaluate. The Cougars since 2013 have averaged 1.43M viewers against Power 5 opponents in all 36 of those games. Even when taking a stricter look against teams outside of the Big Ten or SEC while also excluding games against USC, UCLA, Notre Dame, Texas, and Oklahoma the BYU Cougars average 1.48M over their top 18 games (proportional sample to Pac 12’s games per school) since 2013. The list of opponents is pretty reasonable for projecting them in the Big 12 as it has Boise State, Utah, one game against UVA, Arizona State, Washington, Baylor, Cincinnati, UCF, Arizona, Houston, UConn, and Utah State. You have a couple bigger names but a mix of better G5 schools with mid-tier P5 brands otherwise.
If you also exclude games against the Pac 12 it drops 1.28M as they make up a significant portion of BYU’s slate- particularly Utah
Compared to the Pac 12’s average of over 1.4M it’s still in the ballpark.
Who Has The Advantage?
The Big 12 and Pac 12 leftovers draw similarly based on the data I have which is my initial thought was that the two would effectively be at a stalemate. The remaining Big 12 schools do better relative to television window expectations during the three early windows but the Pac 12 obviously does well after dark. I do think that in a realignment scenario the Big 12 has an advantage in that the grant of rights runs a year longer than the Pac 12’s and nobody is challenging that to leave for anywhere other than the Big Ten or SEC.
Another advantage that the Big 12 has is that their schools can reliably fill all the time slots for a broadcaster with 11 schools in the Eastern or Central time zone and BYU out west to fill at least some late windows as the Cougars fill 3 home games per year in that slot.
Furthermore there have been reports that the Pac 12 may not be able to put together a competitive contract relative to the Big 12. Jason Scheer of Arizona’s 247 site Wildcat Authority has reported that ESPN has lowballed the Pac 12 in their exclusive negotiating window. Additionally it has been reported that FOX declined to bid which takes one suitor likely away from the league. Unless some other bidder makes a strong play once the rights go to the open market it could end up poorly.
The Athletic itself reported that the consulting firm Navigate had projected the Big 12 and Pac 12 at relatively even league payouts before USC & UCLA left. Note, the projections displayed below accounted for Texas and Oklahoma’s departure but not the USC & UCLA departure according to the Athletic.

Since that time John Canzano has reported that the Pac 12 may have lost 200 million of it’s projected average annual television value off of an original $500 million estimate. This would place them at 30 million per school in TV value alone. Since Navigate’s numbers don’t account for this it’s fair to say that losing around 11 million in projected TV value per school would really provide a gap with the Big 12 if these assumptions are correctly placed.
Currently television money accounts for most of that so taking a hit will be painful if the projections are accurate. Television rights made up around 68% of the league’s revenue in this tax filing from the 2019-2020 year and with the expanded playoff looming after 2025 it figures to be a lower percentage but it’s still going to be a very big chunk of the pie. So if the loss of USC and UCLA hits the Pac 12 around that 40% in television value it’s very possible that the Big 12 may have a significant edge on payouts. This again assumes that the projections and estimates are correct.
What the Pac can rebuild with?
Assuming the Big Ten isn’t adding any more out west where and assuming that the Pac 12 can generate enough payout to fend off a Big 12 raid it’s unclear whether they add anyone. The rumored additions are San Diego State, Fresno State, SMU, and UNLV. I don’t know if they’d add anyone or if they would stop at two additions.
Adding a new team adds exposure to a new market potentially but market penetration has to be considered as well. I think much of the analysis by reporters out there looks at market potential without taking the time to ask whether enough people in that market actually watch the schools. Of the schools available west of the Mississippi River the only somewhat nationally recognizable name appears to be Boise who isn’t getting much consideration. Despite being the most visible program available the Pac 12 seems to be avoiding the school and it’s likely due to academic and cultural fit concerns by the Pac 12 presidents. How different are they in TV appeal? Below is a look at how the MWC schools as well as the two current AAC members west of the Mississippi River perform relative to the original Pac 12 in all games. (Side note- Oregon beat out USC and Stanford jumps up big when USC and Notre Dame are included)
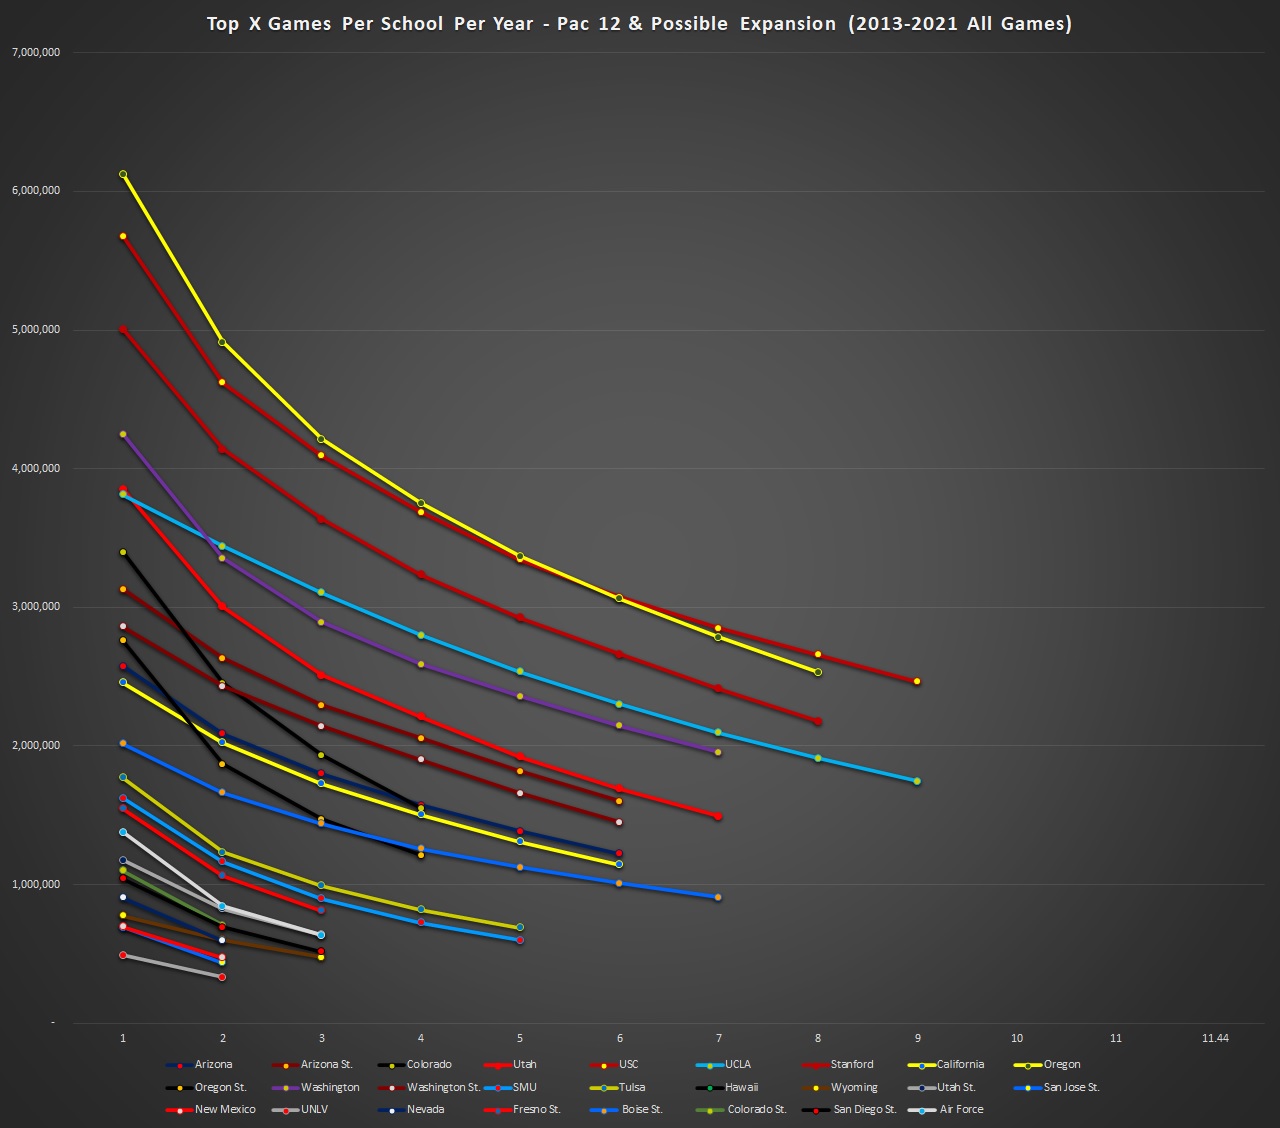
Based off this chart it appears that Boise is the only one with ratings close to the bottom of the Pac 12 which makes sense as their rights have been worth so much relative to their peers that the MWC has had a separate contract for them. Boise hasn’t been as prominent as the late 2000’s but are still well known. To put it in perspective, almost ten million more cumulative viewers were reported for Boise’s 2010 broadcasts on nationally rated networks alone than San Diego State has had since 2013 on nationally rated networks. Additionally the 2009 season also edges out SDSU’s cumulative total over the last nine years. That’s one whopper of brand recognition differential and the Bronco’s are being overlooked in my opinion.
Tulsa and SMU are the next ones up with Fresno on their heels. Rumored frontrunner San Diego State is really in the middle of the MWC in this data. UNLV is another rumored candidate but they are last on this chart.
it’s hard to see how most of these potential additions would not be dilutive to per-team payouts. With 1-2 teams you could maybe scale in a graduated payout where they take less money initially to make the existing members take less of a hit.
The only other school remotely close to the middle of the country outside the Power 5 who’s ratings did well over my 2013-2021 span was Memphis who were around where Boise performed but I don’t expect Pac 12 administrators to push for them.
It Comes Down To The Networks And Business Needs
As with most of realignment it depends on what the networks decide is worth their money. FOX has declined to bid during an exclusive negotiating window hinting they may not be all that interested. ESPN’s current bid according to reports isn’t competitive enough to keep the Pac 12 from going to the open market. Do NBC, CBS, ESPN, or some other bidder do enough to keep them competitive? Do the bidders who may be willing have the combination of exposure & revenue to make it attractive? CBS College Sports Network carries a lot of Mountain West and CUSA games but isn’t the mainstay on more accessible cable tiers that ESPN, ESPN2, ESPNU, or FS1 are. Are brands going to suffer from less exposure if a lead broadcast partner is streaming instead?
I wouldn’t rule out networks pulling a curve ball in either direction. Back in 2010 Fox and ESPN chose to keep existing contract values when the Big 12 lost Colorado and Nebraska and ESPN invested in the Longhorn Network to keep Texas from going west. According to a radio interview with Tech’s president at the time the other offers were contingent on Texas. In that instance they funded staying put.
On the other hand back in 2013 after Pitt, Syracuse, WVU, Louisville, and Notre Dame all left the Big East we saw FOX throw 4 million per school at the seven non-football schools in that league to split off from what is now the AAC. Fox was launching FS1 and needed more basketball content and paid 2-3 million more per school than any non-football arrangement I have seen other than Notre Dame’s with the ACC that has bowl money tied up in it. In that case their business need drove them to effectively fund a raid of both the AAC and to go grab Xavier, Creighton, & Butler from their leagues. So unless you can predict how each network will behave you will need good luck guessing how the payments stack up.
In conclusion the article from the Athletic was very misleading and drew conclusions that I do not think were supported by the data. The Big 12 and Pac 12 remnants drew similarly to each other in the television data I have and the new additions to the Big 12 figure to be a lot stronger than whatever the Pac 12 could add at this point.
Never miss the latest news from SicEm365!
Join our free email list