
Brilliant stuff. NASA level stuff. Well done!
This is the final article in my 2022 TV ratings series. We’ve addressed a major outlet’s flawed analysis, highlighted the importance of television networks & windows, and showed how the conferences performed relative to each other. Now we turn our attention to individual schools.
How NCAA Football Teams Stack Up On Television Viewership
Television ratings are one data point in the complicated mess that is conference realignment. There are several ways that this metric can be skewed and misrepresented. The television network a school appears on is a BIG influence on how a game will perform. Below you see median values for each TV window on a typical Saturday on several prominent networks and the difference is vast.
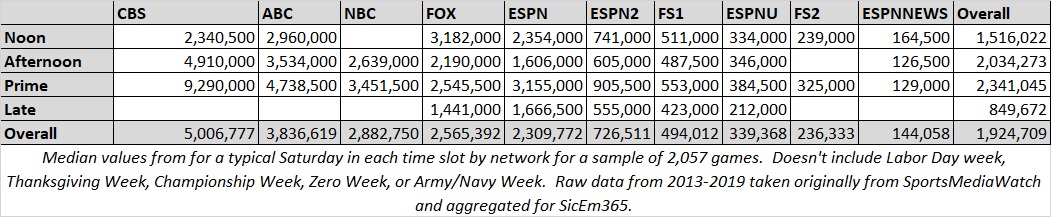
Given that I am attempting to summarize a very large number of schools in this article and trying to do so with simple charts and metrics, there’s only so much granular detail I am going to get into. So, generally limiting it to conference games (not including high floor P5 title games) and comparing schools within each conference will be a way to control for this at least slightly. The idea being that these schools share TV deals, and generally, if there are network differences within these silos it’s due to a combination of long-term brand value and immediate win/loss record or national stakes. In the absence of a much more detailed statistical model, this is a way to segment things out into several ranking groups where the TV deals are at least semi-fair to use for comparison.
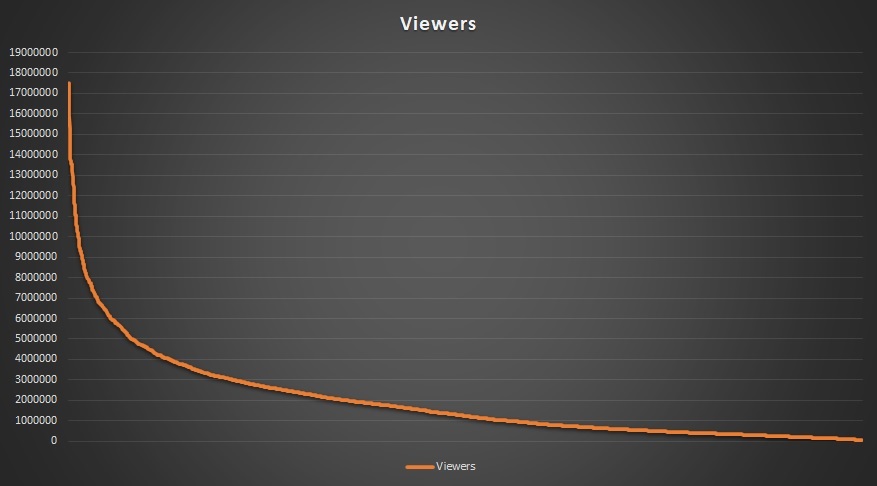
Additionally, we need to control for the number of games per school. Everyone’s sample of games gets worse as you move from the most valuable and, in general, it resembles a hockey stick when distributed on a graph. 50% of the total cumulative viewers are present in the top 15-17% of games. It’s part of why consolidation happens in conference realignment. Moving Texas, OU, and USC to leagues with more giant brands means you have more games on the left side of this graph and more games far enough left where the line is shooting nearly straight up.
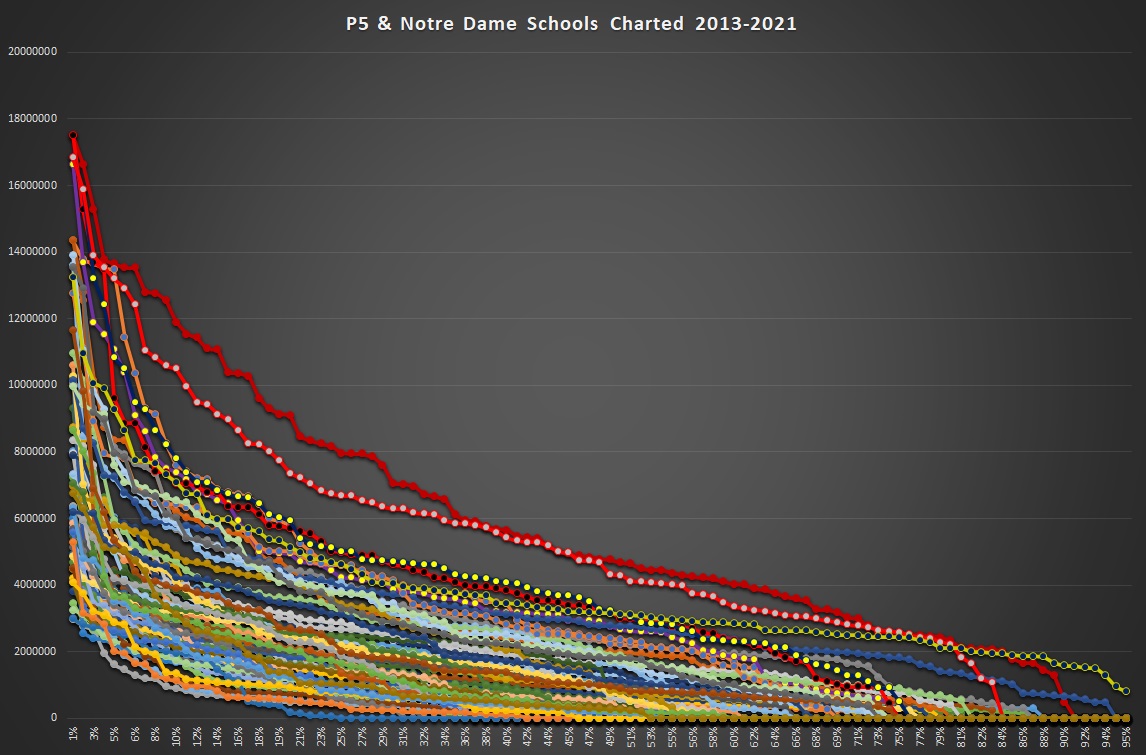
This also holds true when you look at individual schools. Below is a crowded look at all P5 schools and Notre Dame on one chart. Even the two leaders Alabama and Ohio State are trending down at a decent slope.
Not controlling for how much of the schedule is being sampled can lead to awfully foolish conclusions. The example I’ve used as a go-to in this analysis is Vandy & Miami. Vandy is the lowest media draw in the SEC with little historical success, enrollment, and rarely gets good tv windows. Miami by comparison is one of the top ACC brands, has five national titles since 1983, puts tons of players into the NFL, and routinely draws big viewership. This isn’t a close contest yet a simple average in 2018 would imply that Vandy would average more.
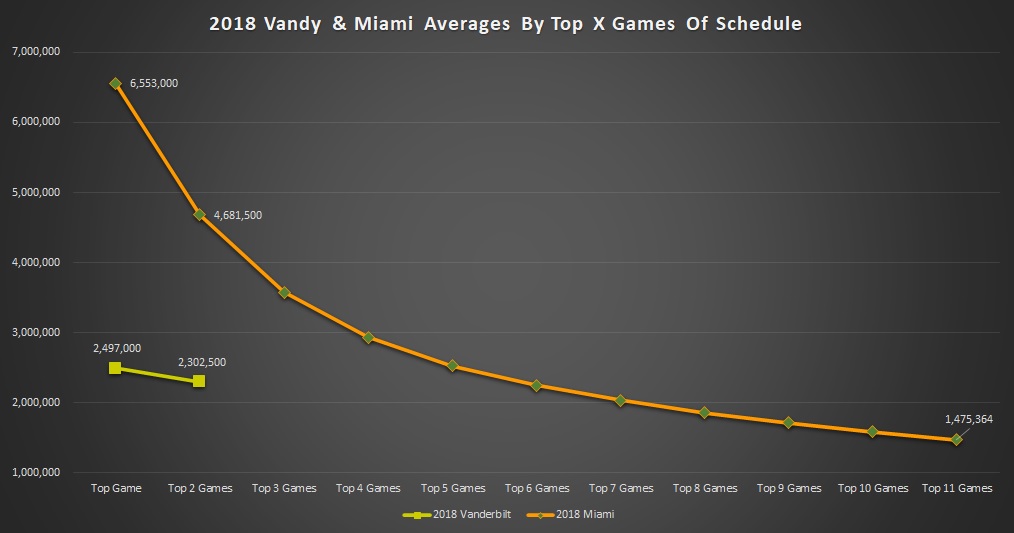
Why is this? 10 of Vanderbilt’s games that year did NOT reach nationally rated networks so the data is unavailable. A simple average just averages available data. Which means the weaker games that don’t merit a nationally rated window get conveniently ignored. So we end up with 11 Miami games competing with two games against Notre Dame and Florida where Vanderbilt rode the coattails of the Gators & Fighting Irish. Miami’s top two games average double what Vandy’s do but using a simple average lets 9 more games including Duke, FIU, and Toledo sink Miami’s average low enough that the Commodores would *technically* outpace the Hurricanes. This is an example where the old phrase “lies, damn lies, and statistics” applies.
We account for this by taking the same number of games per school whether we look at conferences or individual schools. It needs to be apples to apples.
Given these two issues, the limited time available for this analysis, and the large scope of the teams involved we’ve got a few basic ground rules.
- Data Is Since 2013: With the exception of Rutgers, Maryland, Louisville, and some G5 moves almost everyone is in their current conference by then. 2013 is about as far back as we have complete data. 2012 has most of it but significantly less than 2013. I considered 2014 (all of the top 7 leagues in place but Navy) but limited data from the G5 schools pushed me to include more. I left 2020 in there as (A) each conference school faced that year the same way its conference mates did and (B) to allow for as much data for the G5 as possible.
- Conference Games Only: This keeps the groups we are comparing mostly going against each other.
- No P5 Title Games: The Title game exclusion is to prevent rewarding Wake Forest, Utah, Baylor, Northwestern, or Missouri compared to schools like BC, Oregon State, Texas Tech, Illinois, or Arkansas who didn’t qualify for these games as they tend to do REALLY well compared to other TV spots as I addressed in the TV window article. G5 leagues keep theirs as they are usually head to head vs the giant P5 games and their windows tend to perform more like some Labor Day week or Black Friday windows do which are included. Additionally, this also helps the sample size limitations for some G5 leagues and the windows aren’t so dramatically better than what these leagues occasionally see.
With that out of the way let’s go league by league. Since this is a Baylor site we’ll start with the Big 12.
Big 12
This conference is the easiest to get a fair comparison on schedule quality. It’s a round-robin every year. The Big 12 is paced by Texas and Oklahoma and the fact that OU is out in front isn’t a shock. Those two are the blue blood brands and one has been in playoff contention almost every year. OSU starts off ahead with several high visibility games against OU, Baylor, and WVU elevating them initially before UT eventually pulls ahead. 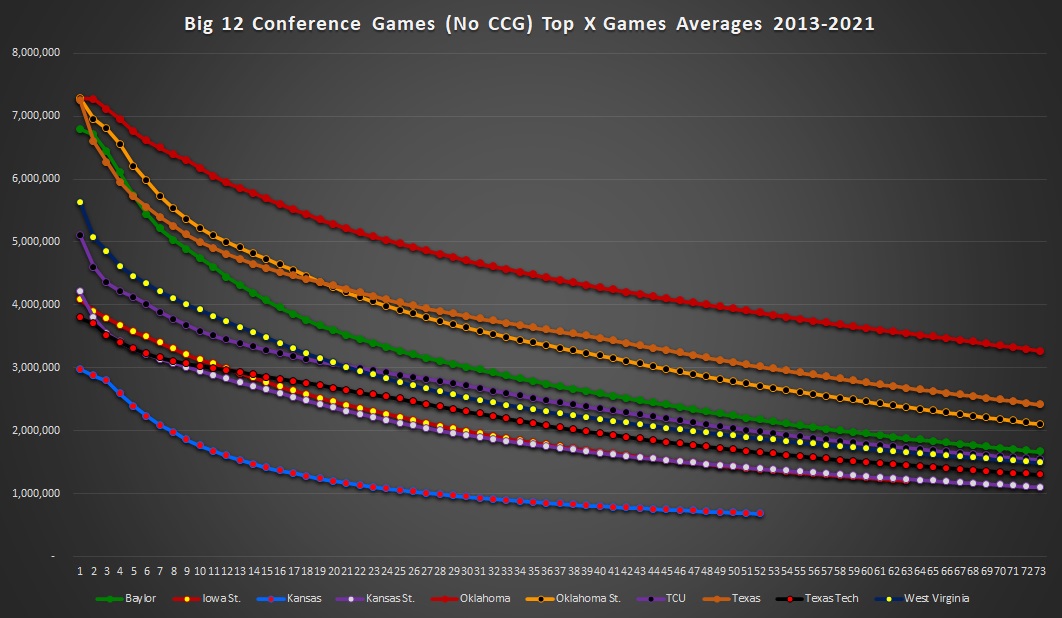
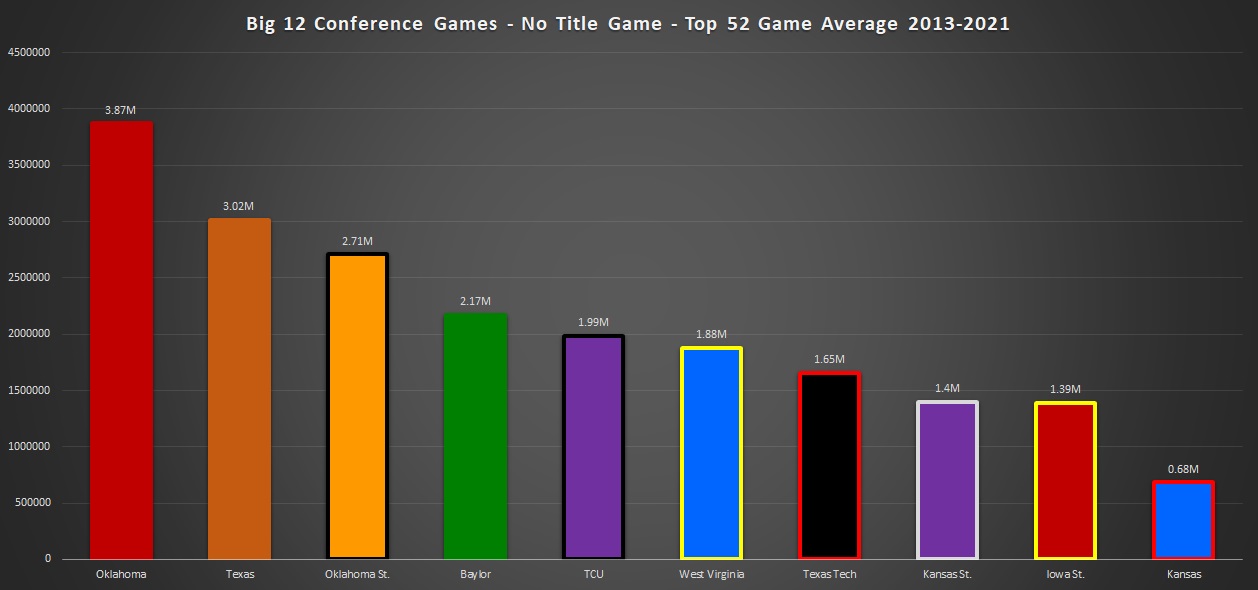
Then BU is next up and performed stronger than I expected. WVU has a few more big games but TCU eventually catches up and slightly passes them as more games factor into the average. Tech eventually pulls ahead of ISU & KSU who are incredibly even throughout and start off ahead with more championship hunt seasons than the Red Raiders helping them out. Obviously, Kansas is a distant 10th. Below we see the school averages ranked at their top 52 games, a number chosen because is the maximum number of games that all ten schools had data for.
One of my other articles had a section that broke down how the Big 12's remaining eight performed without Texas and OU (and how the Pac12 do without SC & UCLA) so I won’t rehash that here. Instead, let’s see how schools perform without JUST Oklahoma.
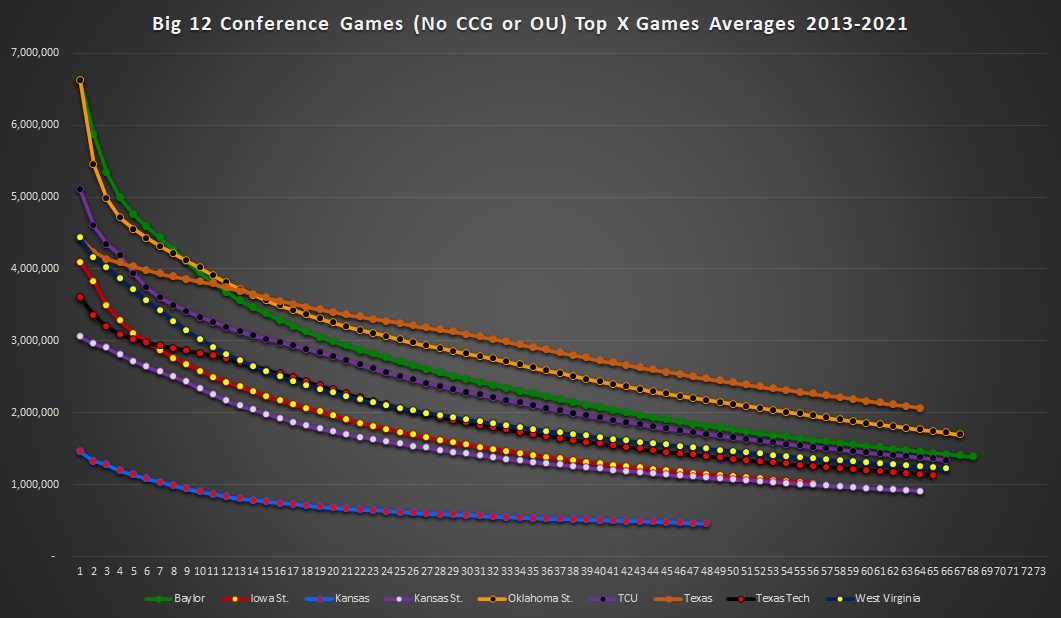
Taking out OU makes for an interesting change. It takes several of the top games away from everyone but really impacted UT as their struggles to get to mid-October with fewer than two losses have limited their giant rating games against other league foes since they face OU in early October every year. Baylor, OSU, and TCU start off ahead before UT eventually overtakes them as their constant presence on ABC & FOX rules the day. UT’s in front but it shocked me how close it was without OU in there. However, it should be said this recent stretch for them is about as struggling as we can expect them to be in the Big 12 and the lack of major late-season stakes for their games in most seasons during this sample is hurting them. Their 2018 WVU game is the top non-OU performer for them.
Oklahoma State without Bedlam was surprising as well. A lot of top games against Baylor and WVU helped them. Baylor remains a clear #3 but the gap closed a bit while TCU leaps WVU as the Mountaineers had more showcase games against the Sooners while TCU’s 2015 game against Baylor along with 2014 games vs ISU, WVU, and Baylor paced them and the only OU game in TCU’s top 5 was the 2015 edition. WVU maintains an edge over TTU and ISU but losing the matchup that populated half of their top ten league showings impacted them in the revised analysis. KU again comes up last to nobody’s shock.
The SEC
The SEC was the top performer on my conference ranking and has the #1 overall performer and longest-running modern dynasty Alabama. Here’s how the schools behave over different numbers of games being averaged.
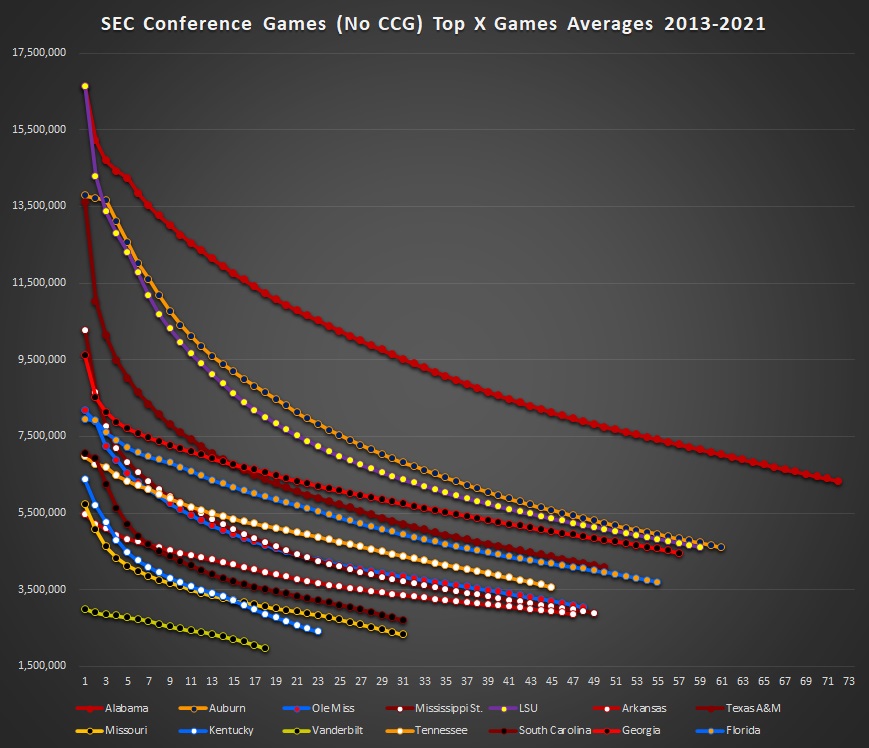
Clearly, Alabama is WAY out in front with their involvement in all 23 of the top games in the sample. Then it’s a close match between Auburn and LSU for 2nd place with Auburn eventually getting an edge. The Iron Bowl’s Thanksgiving Saturday matchup accounts for 8 of the top 20. LSU-Bama 2019 is the top SEC game in the sample and their matchup accounts for 6 of the top 20. UGA is the standard bearer for the SEC East & eventually overtakes Texas A&M for 4th place after the Aggies run out of 2013 Johnny Manziel games which make up 6 of A&M’s top 17 with the 2013 matchup being their highest game overall. The next up is Florida who is then eventually followed by Tennessee, Ole Miss, MSU, Arkansas, South Carolina, Mizzou, UK, and Vandy.
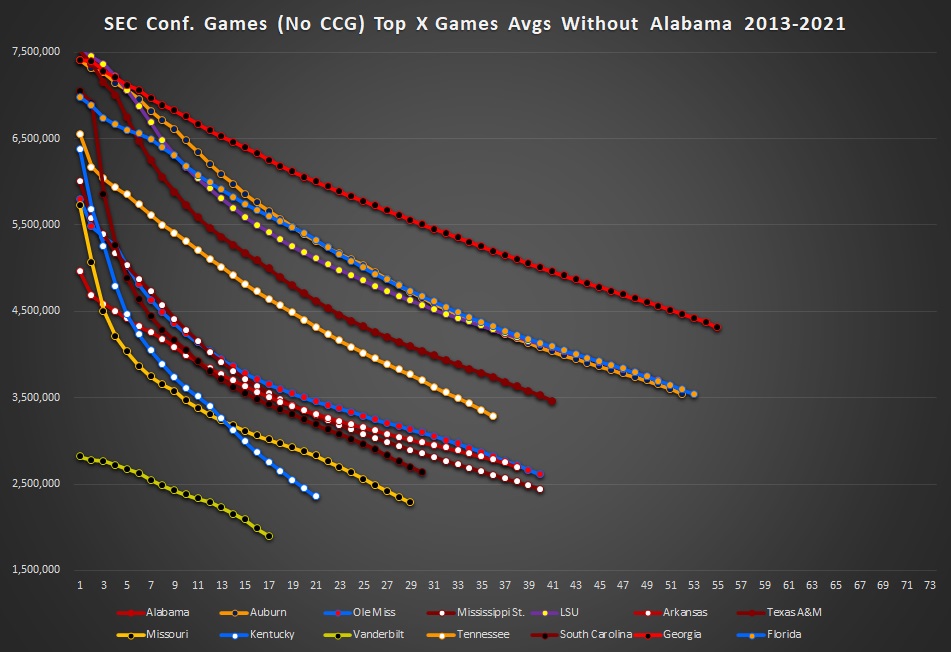
However, there is a giant thumb on the scale here: Bama. The performance without them is dramatically different. We see UGA jump from 4th or 5th (depending on how many games sampled) up to probably the top team of the remaining 13. Then Auburn, Florida, and LSU are all bunched together with Texas A&M edging out Tennessee. Then you have another bunch of schools with the Mississippi duo, South Carolina, and Arkansas all in a tight grouping. Mizzou & UK trade leads and Vandy is again last.
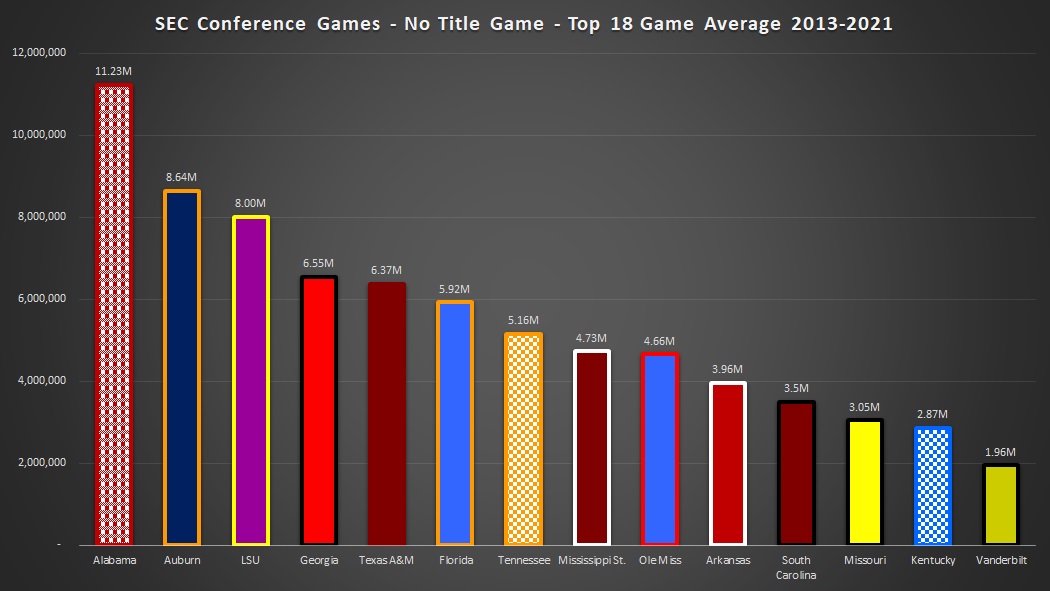
If we were to rank the schools at one point on the graph I tend to choose the number of games that the school with the smallest sample has. In this case, it’s Vandy with 18 games. Here’s the result of everyone’s top 18.
However here’s the ranking without Alabama, whose constant presence on LSU, Auburn, A&M, Arkansas, Tennessee, Ole Miss, and MSU’s schedules gives them an artificial boost.
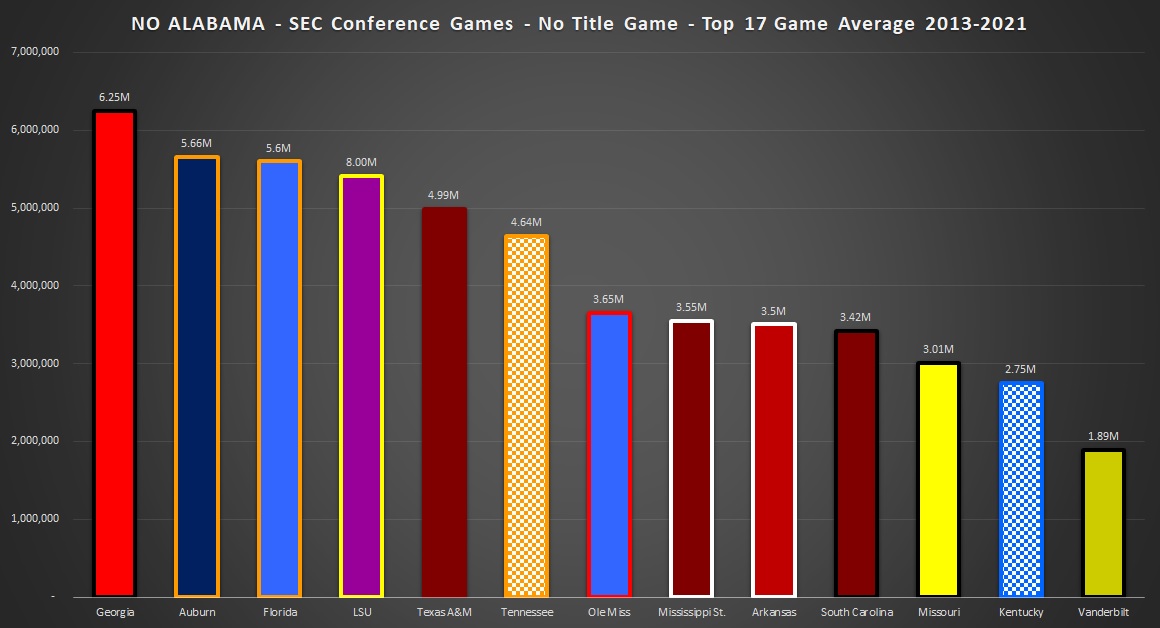
Without Bama skewing it the league ends up in tiers that most would probably agree with going in. UGA, Auburn, Florida, & LSU out front, A&M and Tennessee next, then a grouping of the Mississippi schools, South Carolina, and Arkansas before Mizzou, UK, and Vandy.
Big Ten
The next league is the Big Ten and they have the No. 2 overall performer in the Ohio State Buckeyes. Below we see how they behave and it’s safe to say there is a clear top two.
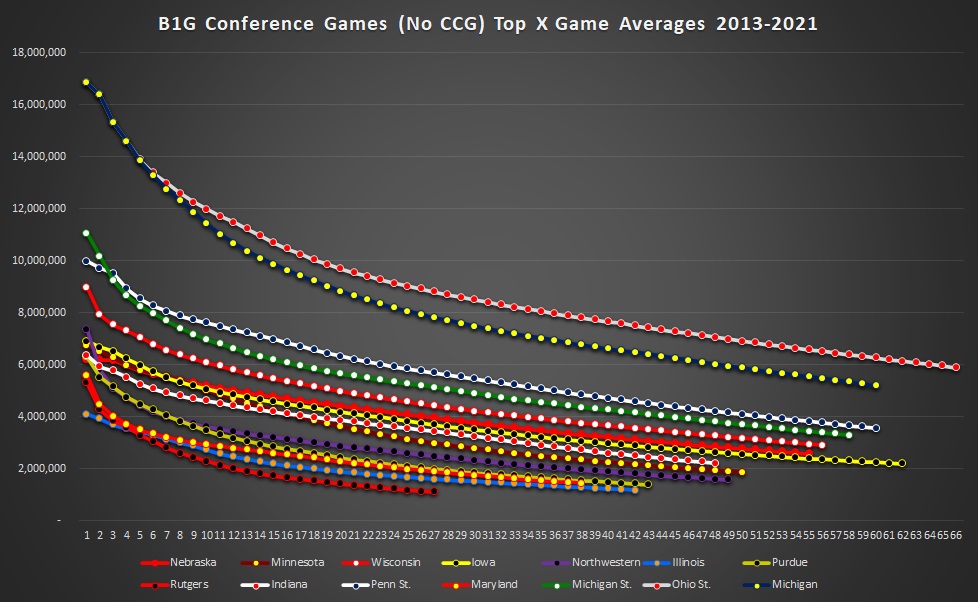
Ohio State and Michigan make up 9 of the top 14 Big Ten conference games and each is involved in the top 16 and 20 of the top 22 games. Next up is Penn State and then MSU who both face each of them every year. Right on their heels though are Wisconsin and then Nebraska and Iowa, as those three pace the Big Ten West. Indiana comes next followed by Minnesota, Northwestern, Purdue, Maryland, Illinois, and Rutgers.
How does taking the Buckeyes and Wolverines out of it change things?
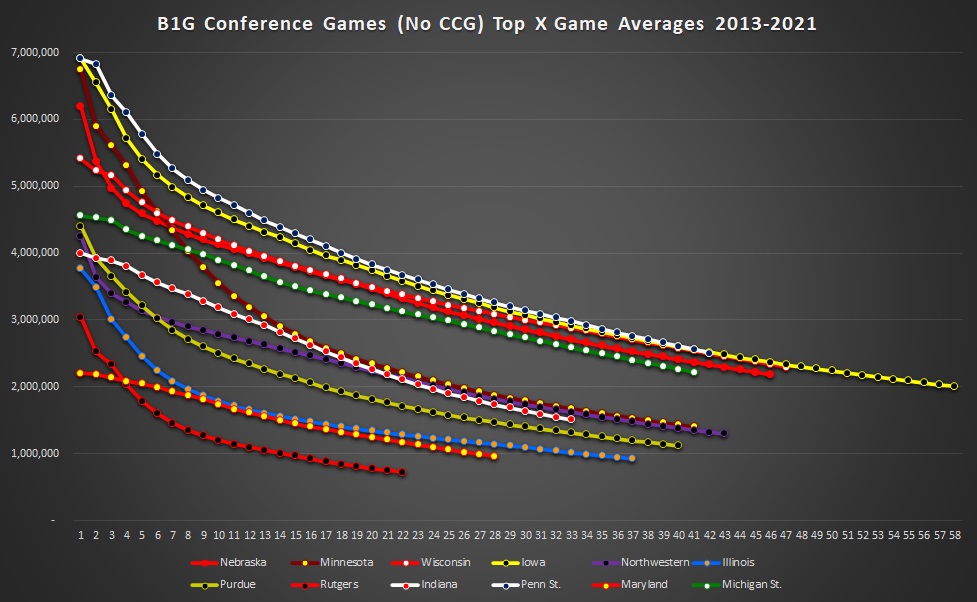
It leaves Penn State as the top performer and it makes sense as the Nittany Lions are a blue blood with some solid success during recent years. Iowa, Nebraska, and Wisconsin are the next group as it’s the class of the division that didn’t have their best opponents removed. MSU rounds out the top group after falling back a bit without their two annual matchups.
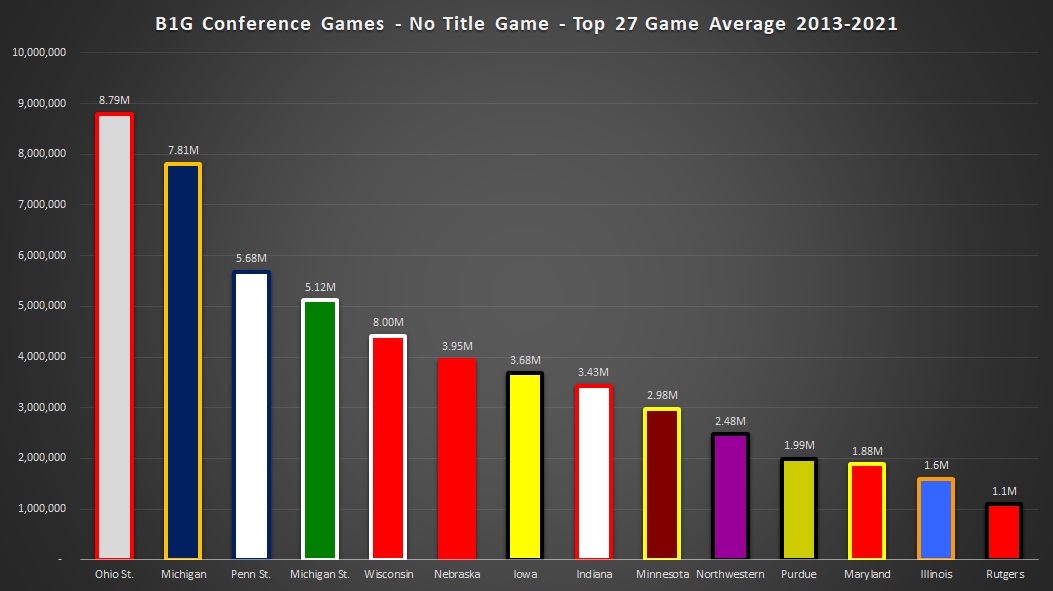
If we do a quick ranking using the maximum number of games that all members have (Rutgers has the fewest) we end up with this for the overall league.
Here’s how it looks without the big two. MSU and Indiana probably lose the most ground with the change while Iowa benefits from the omission as not only is MSU impacted but to a lesser extent Wisconsin & Nebraska.
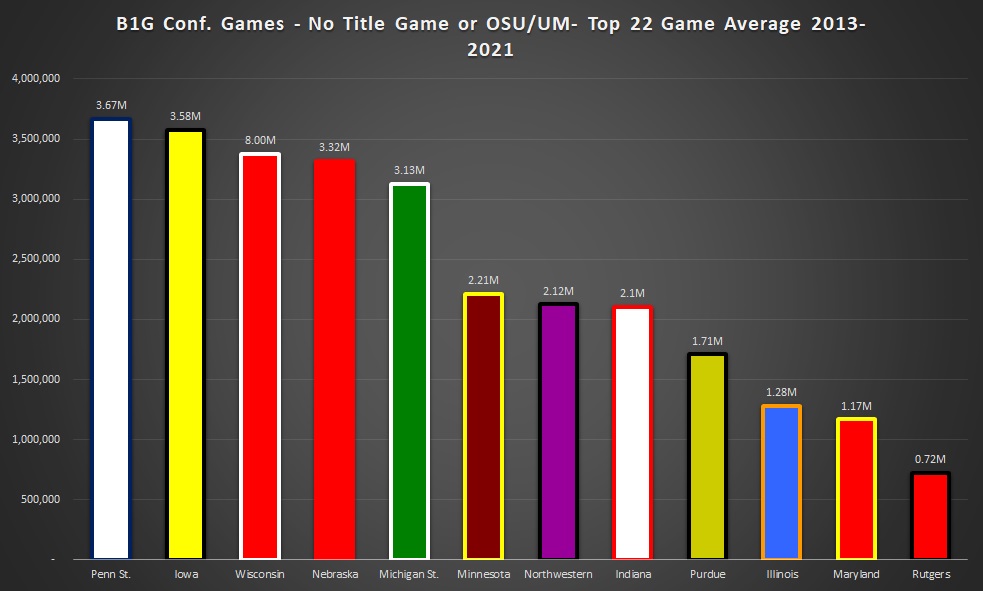
These rankings confirm a lot of people’s opinions on the three recent additions. Nebraska helps more on over-the-air ratings while the later additions of Rutgers & Maryland may help a ton on the Big Ten Network carriage fee revenue but have not drawn as strongly over the air.
ACC
The ACC has three main brands pacing them with FSU, Clemson, and Miami generally in that order. It’s not shocking as FSU is probably the closest to being a blue blood and had nationally relevant success from 2013-2015. Clemson obviously has had an incredible amount of success and has been elite all decade. Miami hasn’t been dominant but their brand is immense.
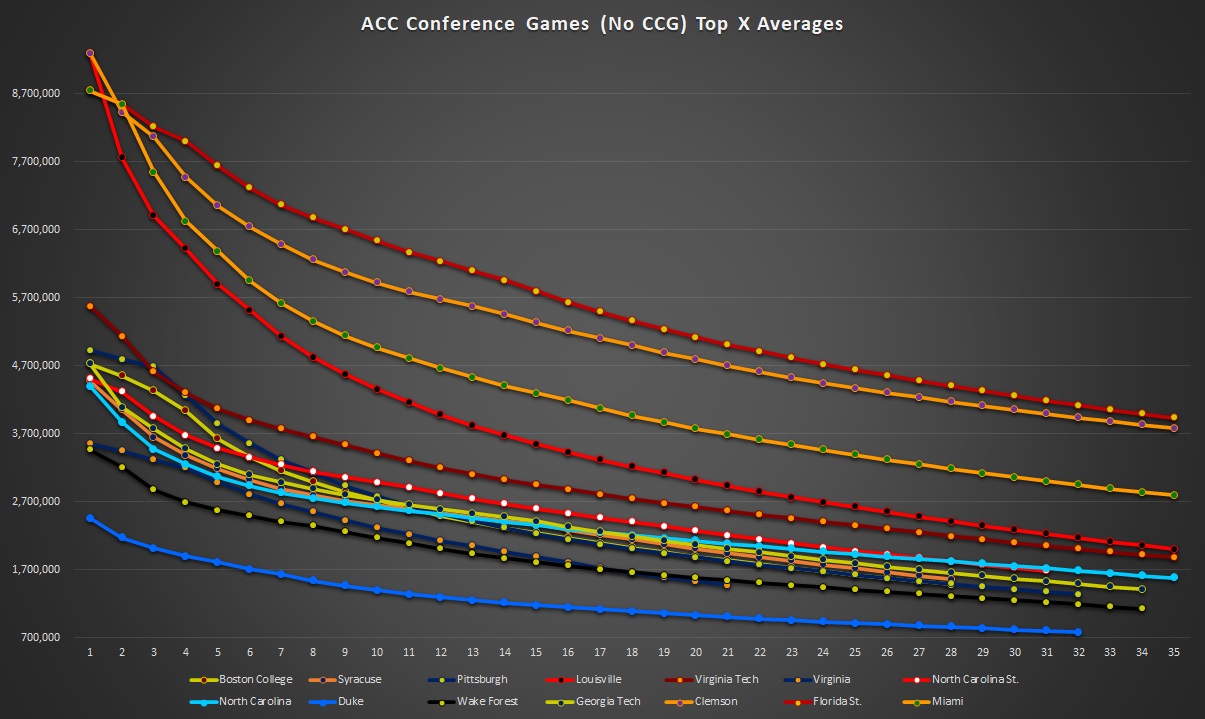
Louisville shows up next leveraging three GIANT games against FSU and Clemson during the 2016 and 2017 Lamar Jackson seasons that went 9.29mm, 6.2mm, and 5.2mm. 10 of the Cardinal’s top 15 ACC games were 2016 or 2017. After Louisville, you see Virginia Tech separate as the next school up. The next group ranking depends on what number of games you average but either Pitt or NC State is next up with UNC, BC, GT, and Syracuse are all close. The final three spots see UVA, Wake, and Duke round out the league.
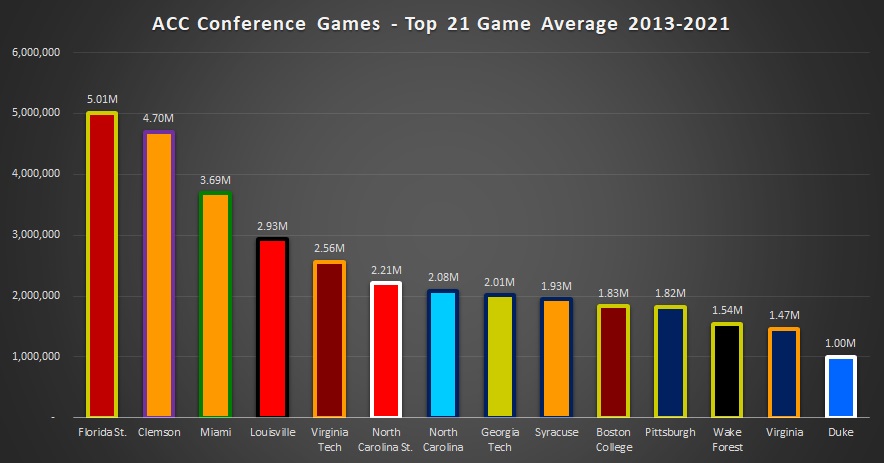
If we sample the top 21 games (UVA’s number) you end up with the following ranking.
Pac 12
The Pac 12 has three schools vying for the top spot with it mostly coming down to USC and Oregon with Stanford as the next challenger. UCLA and Washington are next up while Utah and Wazzu trade leads depending on how many games are in the sample. ASU is clearly next while the remaining schools bunch together at the bottom with Oregon State in last place for any sample of more than ten games.
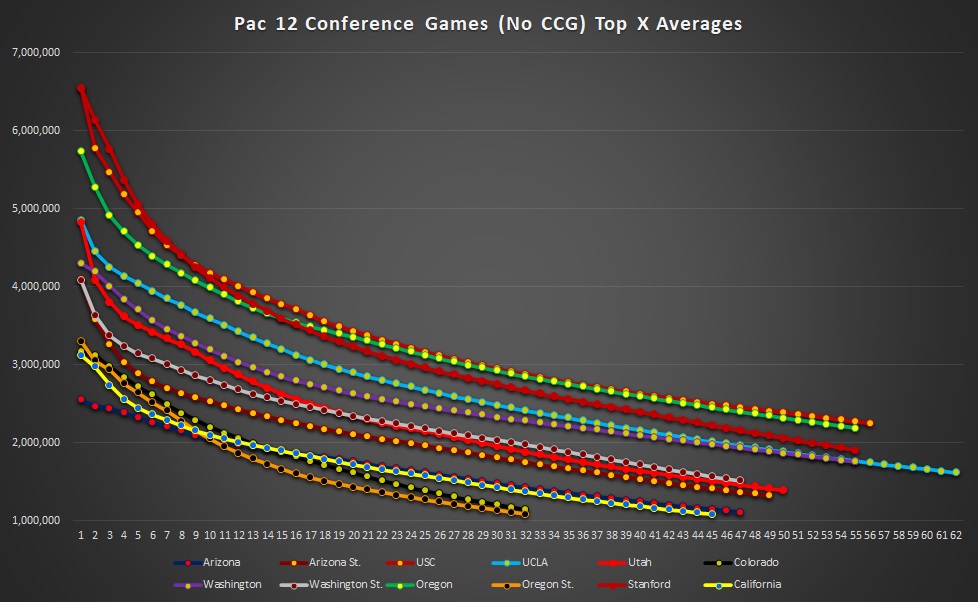
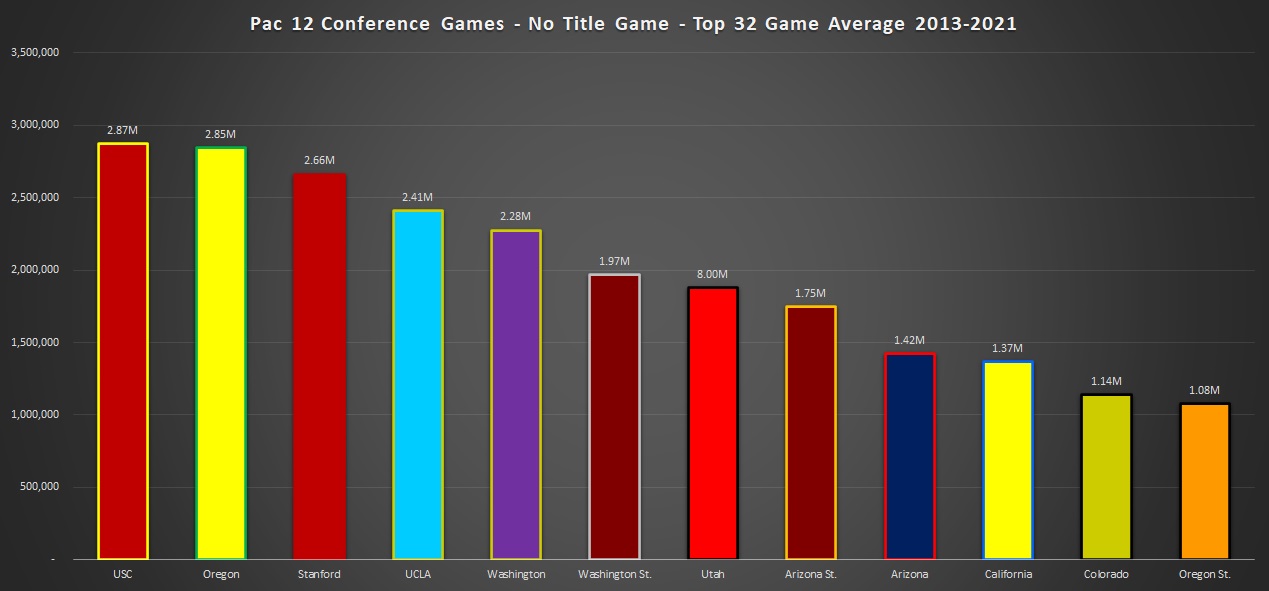
Stanford & Cal are clear beneficiaries of the league’s scheduling format where the California schools play each other cross-division every year while everyone works around that. When USC & UCLA are cross-division it gives the duo a leg up on the northwest schools and they get both UW and Oregon every year further boosting things over the schools in the Pac 12 south. 14 of Stanford’s top 20 games are against USC, UCLA, or Oregon with another three against Washington. Cal manages to still rank low in the pecking order inside the league but more games against the top four brands in the conference every year certainly helps them and probably keeps them out of last place. Below is the ranking of schools if we cut the sample at 32 games. (Colorado’s maximum number of games in the data)
Group Of Five Conferences
As we get into the G5 leagues we’ll start getting to more limited sample sizes. The AAC has enough data to use league games but some others do not. So where the schools below the AAC or MWC get involved I will be using games against non-P5 schools which will also exclude Notre Dame.
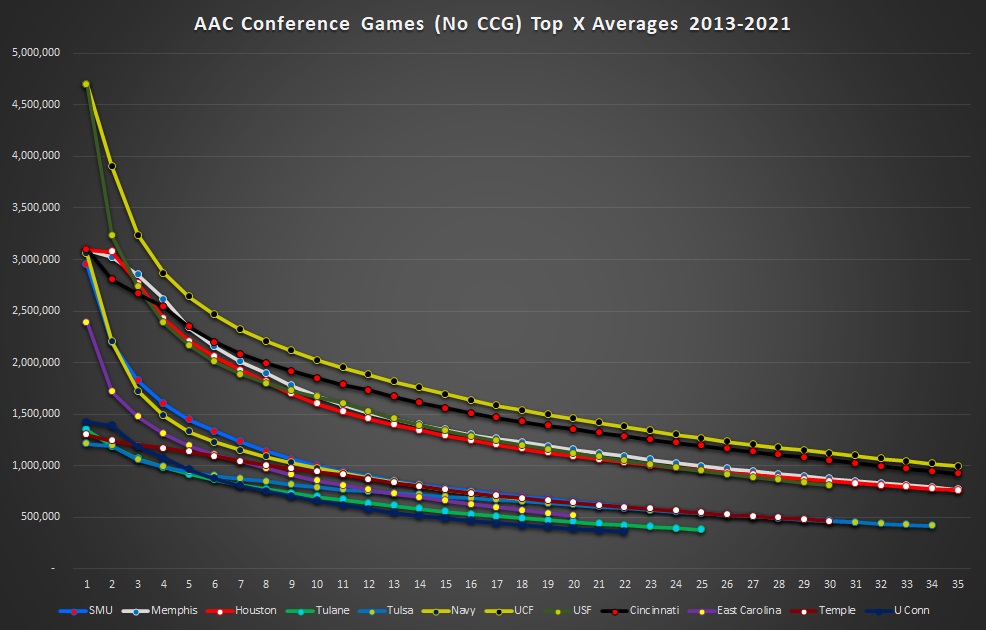
AAC
The AAC data shows UCF and Cincinnati as the top two. After that it’s a tight grouping between Houston, Memphis, and USF for the third spot. The next group leads with SMU and Navy. UConn and Tulane are last depending on the sample size used. (UConn was in the league until 2019 so I included them here)
After realignment, we see how the new additions will need to grow their viewership to replace the three that left. Below are the future AAC teams against non-P5 teams.
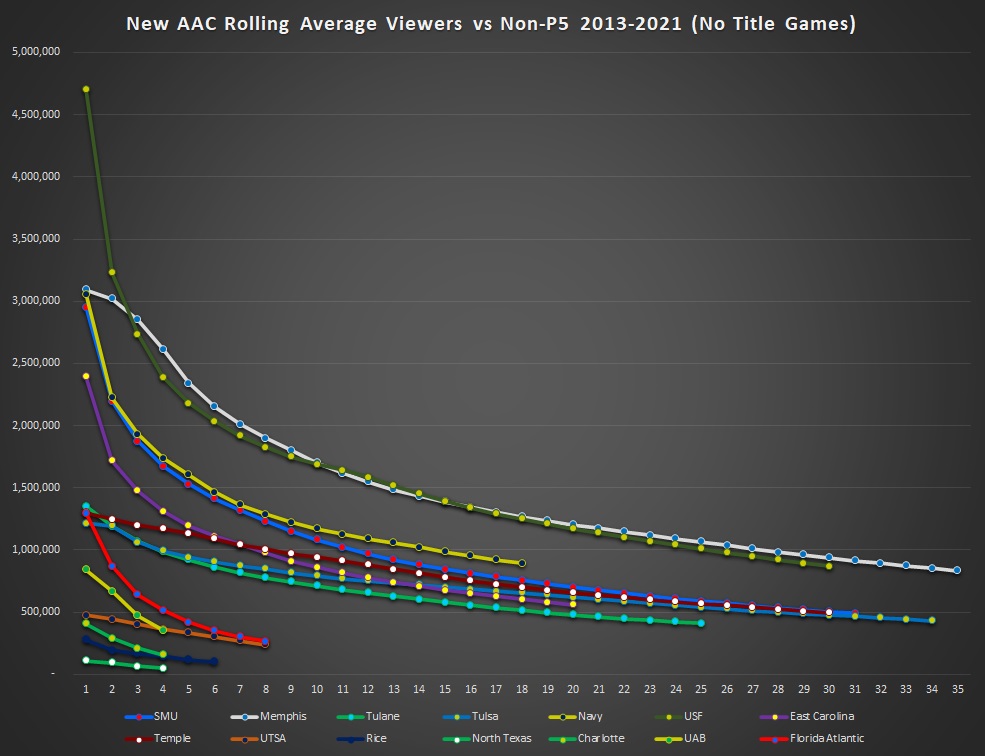
The six additions are the six lowest viewership teams however I expect that to change. C-USA’s television deal was not visible on nationally rated networks and getting more games on ESPN’s family of networks will likely be a welcome change for Rice, UTSA, UNT, FAU, UAB, and Charlotte.
Mountain West
To nobody’s surprise, Boise State is far and away the leader here. The Broncos have had their home games as a second contract to either ESPN or FOX during the last two tv deals for a reason.
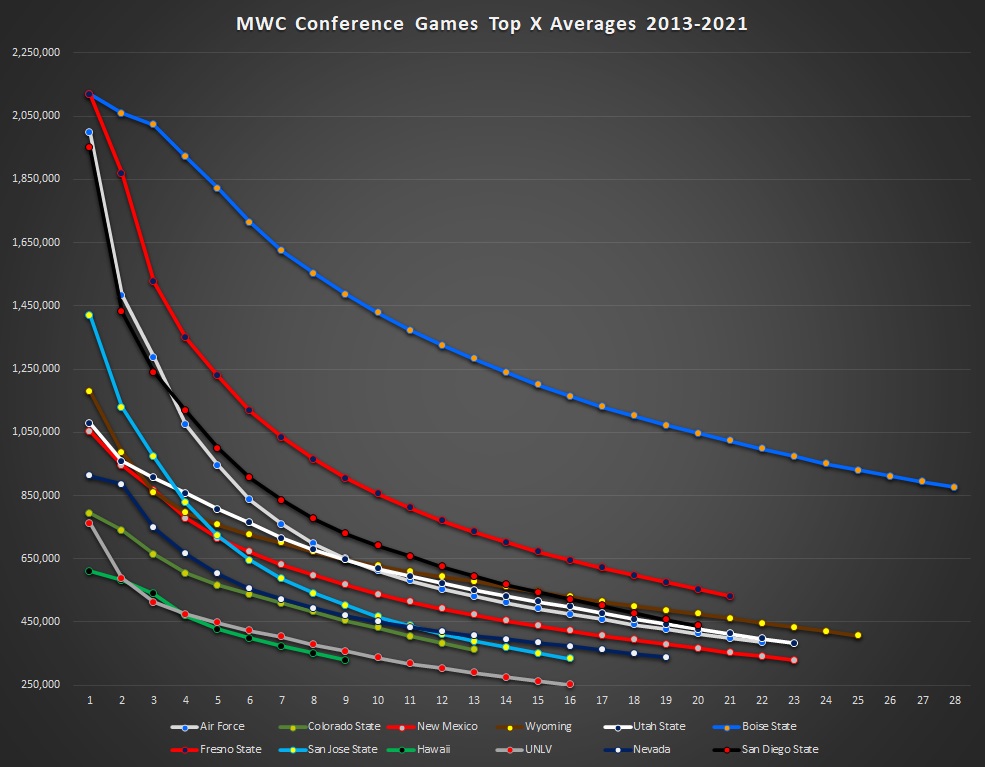
Behind them, you have Fresno State as the clear No. 2. After that it’s a jumbled group with USU, SDSU, and Air Force closely grouped. Hawaii and UNLV come up last. However, Hawaii broadcasting many of their home games to regional television outlets in and around their state will limit the number of available games so they are likely undersold here.
An Overall Ranking
I am not a fan of giving averages without accounting for network and competing games. However in the interest of providing a master list and giving fans some aggregated numbers to play around with I have included each school, the number of games since 2013 in my sample, and what they average in those games.
Additionally, I took the average of a school’s top 36 games over the 9-year sample to get a snapshot of what a school’s top 4 games per year (around 1/3 of the schedule) alongside a ranking of the schools with 36 games available. If your school didn’t have 36 it shows up as “N/A” but between the game count and overall average you can calculate where they’d rank by estimating what their games without data would go for and estimate an average number with those projections.
| School | All 2013-2021 | Top 36 (4 Per Year) | Top 36 Rank |
| Air Force | 30 Games, 0.584mm | N/A | N/A |
| Alabama | 96 Games, 6.363mm | 10.414mm | 1 |
| Appalachian St. | 27 Games, 0.587mm | N/A | N/A |
| Arizona | 57 Games, 1.164mm | 1.572mm | 57 |
| Arizona St. | 61 Games, 1.443mm | 2.054mm | 47 |
| Arkansas | 55 Games, 2.73mm | 3.266mm | 26 |
| Arkansas St. | 24 Games, 0.472mm | N/A | N/A |
| Army | 24 Games, 3.331mm | N/A | N/A |
| Auburn | 78 Games, 4.468mm | 7.197mm | 4 |
| Ball St. | 15 Games, 0.635mm | N/A | N/A |
| Baylor | 88 Games, 1.678mm | 3.103mm | 28 |
| Boise St. | 72 Games, 0.827mm | 1.258mm | 63 |
| Boston College | 35 Games, 1.564mm | N/A | N/A |
| Bowling Green | 25 Games, 0.478mm | N/A | N/A |
| Buffalo | 25 Games, 0.529mm | N/A | N/A |
| BYU | 76 Games, 1.094mm | 1.651mm | 55 |
| California | 57 Games, 1.097mm | 1.501mm | 60 |
| Central Michigan | 17 Games, 0.347mm | N/A | N/A |
| Charlotte | 5 Games, 0.167mm | N/A | N/A |
| Cincinnati | 58 Games, 1.082mm | 1.557mm | 58 |
| Clemson | 90 Games, 3.258mm | 5.419mm | 10 |
| Coastal Carolina | 10 Games, 0.647mm | N/A | N/A |
| Colorado | 39 Games, 1.448mm | 1.549mm | 59 |
| Colorado St. | 22 Games, 0.605mm | N/A | N/A |
| Connecticut | 31 Games, 0.571mm | N/A | N/A |
| Duke | 40 Games, 1.084mm | 1.185mm | 67 |
| East Carolina | 37 Games, 0.547mm | 0.56mm | 75 |
| Eastern Michigan | 9 Games, 0.35mm | N/A | N/A |
| Florida | 74 Games, 3.847mm | 5.848mm | 8 |
| Florida Atlantic | 13 Games, 0.583mm | N/A | N/A |
| Florida International | 10 Games, 0.102mm | N/A | N/A |
| Florida St. | 82 Games, 3.312mm | 5.589mm | 9 |
| Fresno St. | 33 Games, 0.697mm | N/A | N/A |
| Georgia | 79 Games, 4.69mm | 7.119mm | 5 |
| Georgia Southern | 18 Games, 0.269mm | N/A | N/A |
| Georgia St. | 9 Games, 0.434mm | N/A | N/A |
| Georgia Tech | 49 Games, 1.824mm | 2.385mm | 41 |
| Hawaii | 15 Games, 0.55mm | N/A | N/A |
| Houston | 62 Games, 0.951mm | 1.409mm | 61 |
| Illinois | 50 Games, 1.071mm | 1.383mm | 62 |
| Indiana | 57 Games, 1.918mm | 2.868mm | 33 |
| Iowa | 81 Games, 2.158mm | 3.652mm | 22 |
| Iowa St. | 79 Games, 1.204mm | 2.074mm | 46 |
| Kansas | 62 Games, 0.627mm | 0.876mm | 71 |
| Kansas St. | 83 Games, 1.121mm | 2.008mm | 48 |
| Kent St. | 25 Games, 0.503mm | N/A | N/A |
| Kentucky | 32 Games, 1.965mm | N/A | N/A |
| Liberty | 4 Games, 0.138mm | N/A | N/A |
| Louisiana Tech | 14 Games, 0.334mm | N/A | N/A |
| Louisville | 60 Games, 1.951mm | 2.855mm | 34 |
| LSU | 80 Games, 4.167mm | 6.636mm | 6 |
| Marshall | 18 Games, 0.498mm | N/A | N/A |
| Maryland | 54 Games, 1.256mm | 1.752mm | 52 |
| Massachusetts | 6 Games, 0.468mm | N/A | N/A |
| Memphis | 52 Games, 0.918mm | 1.257mm | 64 |
| Miami | 76 Games, 2.139mm | 3.62mm | 23 |
| Miami (OH) | 15 Games, 0.405mm | N/A | N/A |
| Michigan | 81 Games, 4.897mm | 7.376mm | 3 |
| Michigan St. | 79 Games, 3.279mm | 5.382mm | 11 |
| Middle Tennessee St. | 12 Games, 0.359mm | N/A | N/A |
| Minnesota | 57 Games, 1.72mm | 2.465mm | 40 |
| Mississippi | 63 Games, 2.76mm | 3.886mm | 18 |
| Mississippi St. | 62 Games, 2.445mm | 3.451mm | 25 |
| Missouri | 42 Games, 2.516mm | 2.89mm | 32 |
| Navy | 45 Games, 2.33mm | 2.819mm | 35 |
| Nebraska | 72 Games, 2.454mm | 3.863mm | 19 |
| Nevada | 24 Games, 0.493mm | N/A | N/A |
| New Mexico | 25 Games, 0.371mm | N/A | N/A |
| New Mexico St. | 3 Games, 0.167mm | N/A | N/A |
| North Carolina | 56 Games, 1.699mm | 2.355mm | 42 |
| North Carolina St. | 39 Games, 1.593mm | 1.708mm | 54 |
| North Texas | 8 Games, 0.252mm | N/A | N/A |
| Northern Illinois | 36 Games, 0.648mm | 0.648mm | 74 |
| Northwestern | 64 Games, 1.685mm | 2.714mm | 37 |
| Notre Dame | 103 Games, 3.839mm | 6.236mm | 7 |
| Ohio | 29 Games, 0.44mm | N/A | N/A |
| Ohio St. | 91 Games, 5.833mm | 9.132mm | 2 |
| Oklahoma | 101 Games, 3.243mm | 5.247mm | 14 |
| Oklahoma St. | 94 Games, 1.943mm | 3.574mm | 24 |
| Old Dominion | 5 Games, 0.186mm | N/A | N/A |
| Oregon | 74 Games, 2.521mm | 3.755mm | 20 |
| Oregon St. | 40 Games, 1.124mm | 1.214mm | 66 |
| Penn St. | 79 Games, 3.271mm | 5.35mm | 12 |
| Pittsburgh | 49 Games, 1.668mm | 2.08mm | 45 |
| Purdue | 58 Games, 1.317mm | 1.92mm | 49 |
| Rice | 13 Games, 0.836mm | N/A | N/A |
| Rutgers | 43 Games, 0.87mm | 1.039mm | 69 |
| Sam Houston St. | 2 Games, 0.09mm | N/A | N/A |
| San Diego St. | 28 Games, 0.522mm | N/A | N/A |
| San Jose St. | 20 Games, 0.398mm | N/A | N/A |
| SMU | 45 Games, 0.599mm | 0.728mm | 73 |
| South Alabama | 15 Games, 0.42mm | N/A | N/A |
| South Carolina | 47 Games, 2.555mm | 3.079mm | 29 |
| Southern Miss | 11 Games, 0.541mm | N/A | N/A |
| Stanford | 76 Games, 2.023mm | 3.236mm | 27 |
| Syracuse | 37 Games, 1.711mm | 1.754mm | 51 |
| TCU | 91 Games, 1.551mm | 2.966mm | 31 |
| Temple | 42 Games, 0.773mm | 0.891mm | 70 |
| Tennessee | 59 Games, 3.244mm | 4.377mm | 17 |
| Texas | 88 Games, 2.693mm | 4.432mm | 16 |
| Texas A&M | 70 Games, 3.414mm | 5.126mm | 15 |
| Texas St. | 15 Games, 0.337mm | N/A | N/A |
| Texas Tech | 84 Games, 1.316mm | 2.271mm | 43 |
| Toledo | 31 Games, 0.439mm | N/A | N/A |
| Troy | 20 Games, 0.267mm | N/A | N/A |
| Tulane | 35 Games, 0.419mm | N/A | N/A |
| Tulsa | 51 Games, 0.603mm | 0.82mm | 72 |
| UAB | 8 Games, 0.552mm | N/A | N/A |
| UCF | 65 Games, 1.012mm | 1.629mm | 56 |
| UCLA | 80 Games, 1.696mm | 2.795mm | 36 |
| ULL | 25 Games, 0.562mm | N/A | N/A |
| ULM | 10 Games, 0.269mm | N/A | N/A |
| UNLV | 20 Games, 0.307mm | N/A | N/A |
| USC | 87 Games, 2.306mm | 3.684mm | 21 |
| USF | 48 Games, 0.861mm | 1.103mm | 68 |
| Utah | 64 Games, 1.524mm | 2.226mm | 44 |
| Utah St. | 33 Games, 0.563mm | N/A | N/A |
| UTEP | 12 Games, 0.444mm | N/A | N/A |
| UTSA | 16 Games, 0.314mm | N/A | N/A |
| Vanderbilt | 25 Games, 1.543mm | N/A | N/A |
| Virginia | 38 Games, 1.637mm | 1.717mm | 53 |
| Virginia Tech | 64 Games, 1.921mm | 3.013mm | 30 |
| Wake Forest | 40 Games, 1.19mm | 1.248mm | 65 |
| Washington | 70 Games, 1.796mm | 2.587mm | 39 |
| Washington St. | 56 Games, 1.407mm | 1.905mm | 50 |
| West Virginia | 89 Games, 1.47mm | 2.587mm | 38 |
| Western Kentucky | 18 Games, 0.553mm | N/A | N/A |
| Western Michigan | 26 Games, 0.603mm | N/A | N/A |
| Wisconsin | 77 Games, 3.221mm | 5.303mm | 13 |
| Wyoming | 29 Games, 0.45mm | N/A | N/A |
Conclusion
This series has shown a lot of data indicating how much the network a game appears on and the time slot it appears in matters as that tends to control how many competing games it shares the audience with. To nobody’s surprise, the biggest brands and the biggest conferences grab the vast majority of preferred spots.
It will be interesting to see how the next round of television deals and the next round of realignment impact these figures going forward.
Follow @Baylor_S11 on Twitter!
Methodology Footnotes:
- Data taken from SportsMediaWatch and aggregated for SicEm365.
- For games with ratings data and no specific viewership numbers some games were estimated using equally rated games with corresponding viewer counts.
- For regional coverage where a percentage of the country gets the game on one network and the rest of the country either does not get the game or gets it on another network an estimate was used. If a coverage map was present the percentage of the nation’s TV sets by DMA getting the game on each network was used and applied to the viewership numbers. Without a coverage map games were split between the number of games sharing the networks. I explained this further in my article last year in the paragraphs around the green and blue map.
Never miss the latest news from SicEm365!
Join our free email list