S11 Stats Preview: Inside Samford’s Statistical Struggles & Fall From Being FCS Contender
This is part two of my Baylor-Samford preview, covering Samford’s recent statistical performance. Part 1 covered their roster, while Part 3 will cover their X’s and O’s.
Samford Seeks To Right The Ship After A Slide Since 2022’s Playoff Team
Back in 2022, Samford was a very strong FCS team with its only losses in an 11-2 season coming at the hands of FCS national runner-up North Dakota State and the FBS champion Georgia, who dominated TCU in the title game. They took down multiple ranked teams that year. Since then, they’ve gone 6-5 and 4-7 the last two years before opening 0-2, which has put a realistic minimum of four losses once Baylor and Texas A&M make their mark, and potentially much worse. What has led to these breakdowns?
Below is a combination of charts and tables to help us understand the resume from recent years. The tables compare Samford's performance against its opponents with that of other teams against the same opponents. The charts will feature a given metric, with Samford represented in red and blue, and either the opponent in their colors or other Power Four teams on their schedule in gray. The backgrounds will be shaded green, yellow or red, respectively, to indicate whether a metric is performing well, average or poor.
Offense
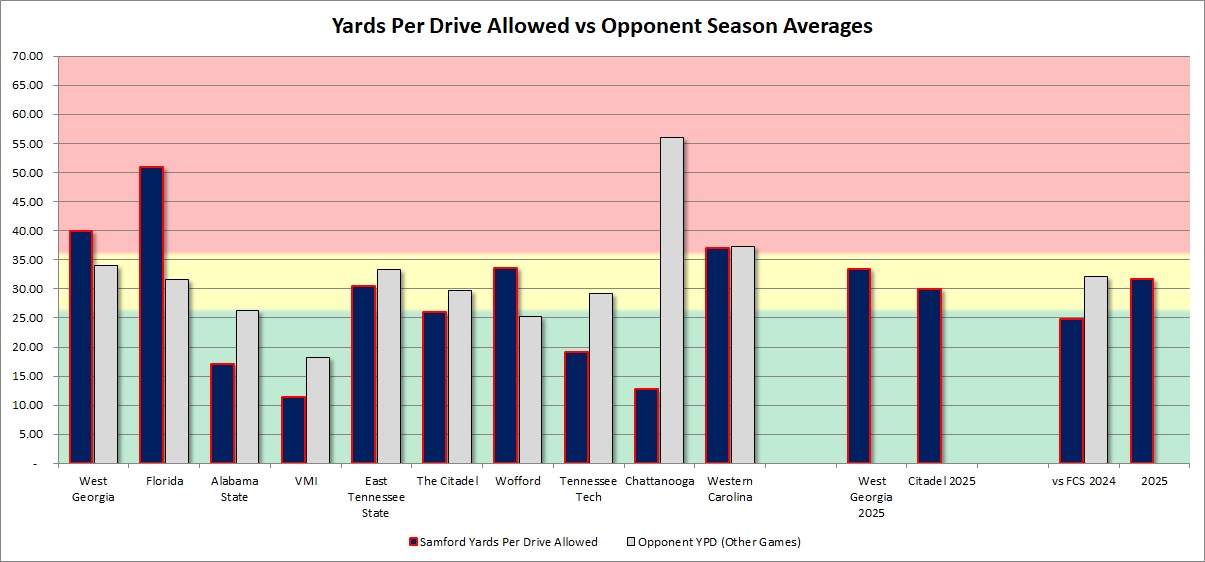
This offense was inconsistent last year in yards per drive, ending the year with huge outings relative to their schedule against Western Carolina and Chattanooga. However, they laid eggs against Citadel and Wofford last year and could not move the ball at all in Week 1 against UWG.
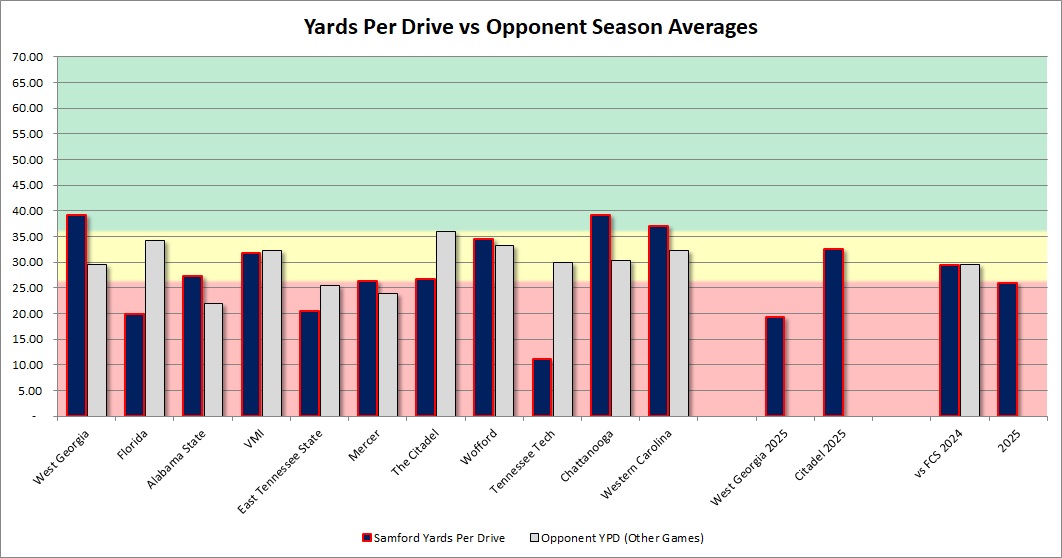
Last year was an offense that gained slightly less than their schedule implies. This year, we don’t have a comparison figure for their schedule, but it’s looking a little worse.
Offensive Overview Stats
This offense has trended downward since 2022 with declines in yards per drive, points per red zone trip, turnovers, yards per play, explosiveness, scoring drive percentage and turnover drive percentage. It’s honestly what I feared may have happened with Baylor from 2021 to 2024 had the Bears not revamped their offense with Jake Spavital.
| 2025 | 2024 | 2023 | 2022 | |
| Yd Drive | 26 | 28.17 | 37.29 | 38.24 |
| Points Per Red Zone Trip | 2 | 4.15 | 4.76 | 5.28 |
| Turnovers Per Game | 4 | 1.85 | 1.09 | 0.92 |
| Yards Per Play | 4.36 | 4.91 | 5.67 | 5.96 |
| Total Yards | 361.5 | 359.31 | 423.73 | 450.08 |
| % Of Drives Scored | 14.29% | 25.44% | 39.2% | 43.14% |
| % Turnover Drives | 28.57% | 14.2% | 9.6% | 7.84% |
| 3rd Down % | 38.46% | 34% | 41.88% | 48.53% |
| 3rd or 4th Down % | 43.59% | 40.5% | 48.75% | 54.9% |
They are average on third down and don’t stay on the field all that well, even if fourth down is utilized.
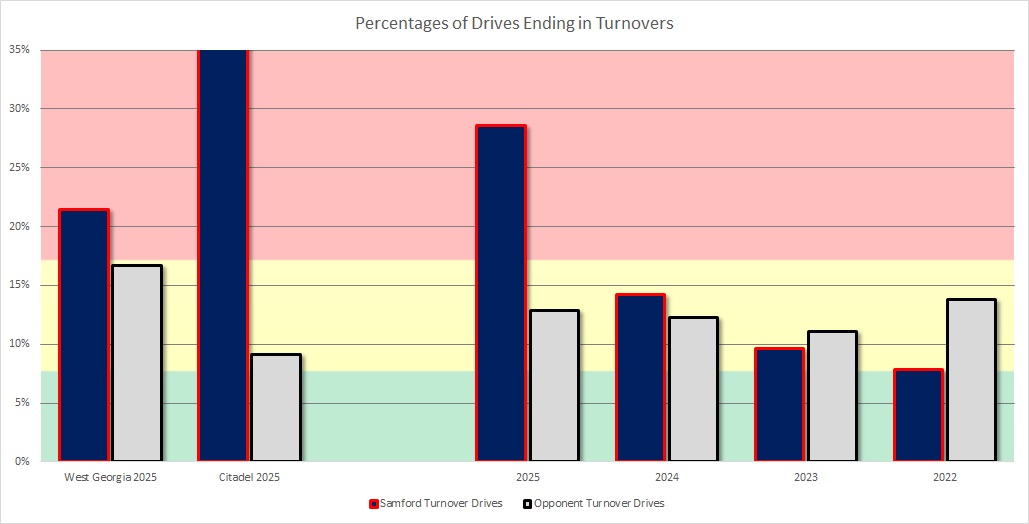
Below, we compare their turnover drive percentages to those of their opponents. We see that in each game this year, they’ve given it away an alarming amount. They’ve forced a decent amount of turnovers that are on par with prior seasons when they had more success. The clear issue is that they are coughing it up more each season.
They were bad in the red zone last year, but not too far off. So far, they’ve been abysmal behind their completely new line.

Offensive Passing Game
Samford is an effective passing team. They complete a lot of passes, albeit for relatively shorter yards per completion, which is typical of a classic pass-first Air Raid that has the “dink and dunk” moniker (not to be confused with the deeper passing and longer protecting “chuck and duck” of the run and shoot). They’ve gotten worse in sack percentage and interception percentage over the last two years, which limits things.
| 2025 | 2024 | 2023 | 2022 | |
| Completion Percentage | 70.75% | 69.57% | 71.08% | 74.62% |
| Yards/Game | 304.5 | 244.45 | 285 | 304.38 |
| Yards/Att | 5.75 | 6.52 | 6.92 | 7.55 |
| Yards/Completion | 8.12 | 9.37 | 9.74 | 10.12 |
| Yards/Pass Including Sacks | 4.9 | 5.66 | 6 | 6.72 |
| Sack % | 7.02% | 6.47% | 7.36% | 5.92% |
| INT % | 2.63% | 2.77% | 1.64% | 0.72% |
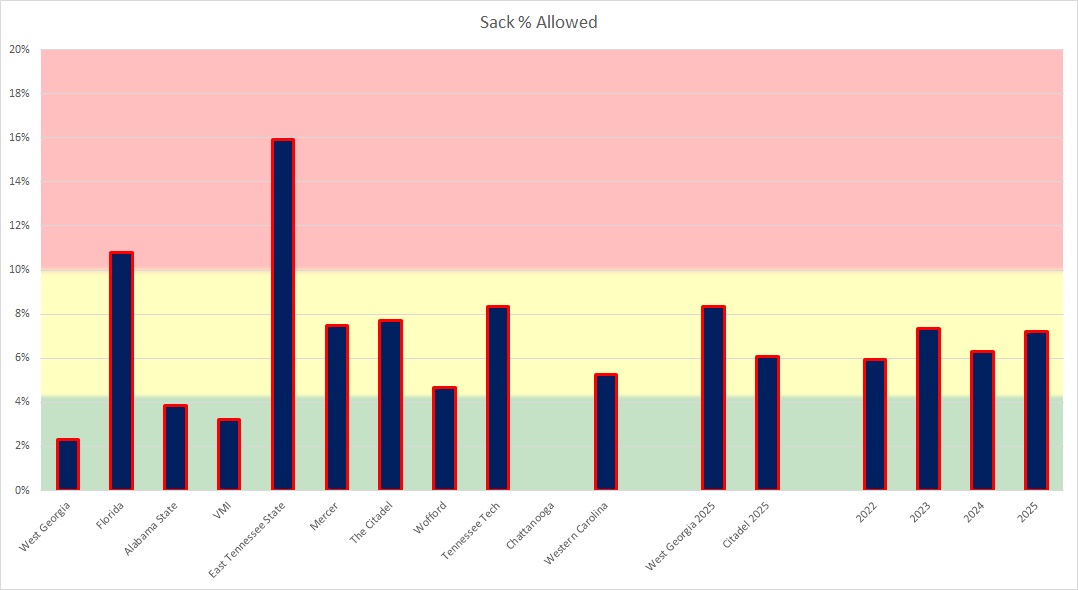
This offense will take shots downfield but largely controls the ball with short passes. In terms of sacks allowed, they do a decent job given the amount of passing they do. Florida and Tennessee State gave them a hard time last year, but they had half the season of really low sack percentages.
Offensive Run Game
The run game has fallen off a cliff. They have a dual-threat QB who has started the last two years, and he’s been the only part of the run game with consistent yardage. Back with their prior pocket passer, their line was better, and they were effective.
| 2025 | 2024 | 2023 | 2022 | |
| Yards/Rush | 1.9 | 3.09 | 4.14 | 4.14 |
| Yards/Non-Sack Carry | 3.15 | 3.93 | 5.19 | 4.97 |
| QB Non-Sack YPC | 4.15 | 4.88 | 3.13 | 4.77 |
| Non-QB YPC | 3 | 3.73 | 5.78 | 5.5 |
| Run Play % | 31.33% | 43.11% | 40.51% | 43.22% |
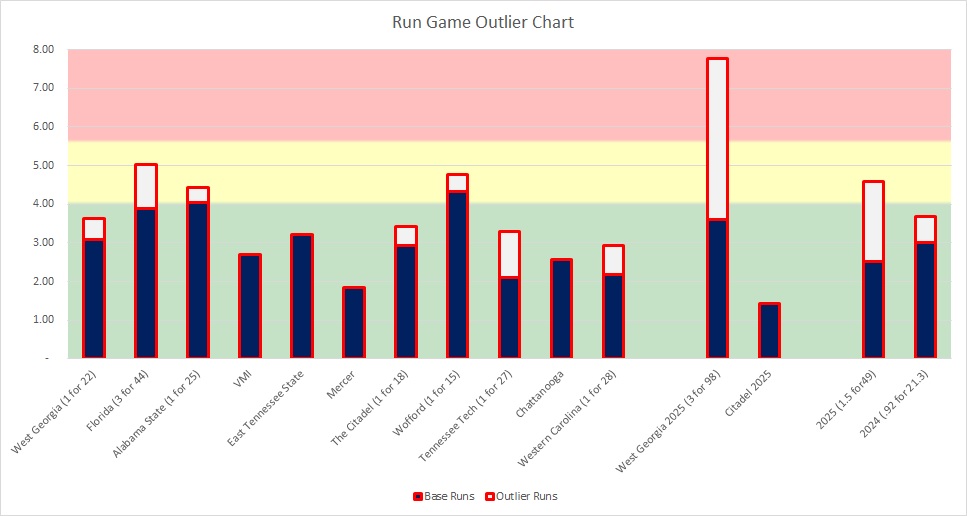
Below, we see a stacked bar chart where the light-colored bars represent the portion of their QB or RB yards per carry average attributable to a very small number of runs of 16 yards or more (not including sacks). The dark-colored bars represent the average of what the other carries. It seeks to show how consistently you moved the ball per carry rather than having one or two long runs spike the number higher.

What we see is a clear decline over the last year. Other than two games against the Citadel since the beginning of last year, you have one game against Western Carolina, where QB Quincy Crittendon went off for 200-plus yards on the ground, which had base carry averages that were solid. They are not a consistent run team and really rely on breaking a sporadic play for a decent average.
Defense
Their defense was their bright spot last year, and aside from two to three games, held everyone below what they averaged elsewhere and often emphatically so. Chattanooga, VMI, Alabama State, Citadel and Tennessee Tech all got handled well. However, their defensive coordinator is now the safeties coach at Cincinnati, and they have hired a new DC who was the coordinator at App State before the previous head coach was let go.
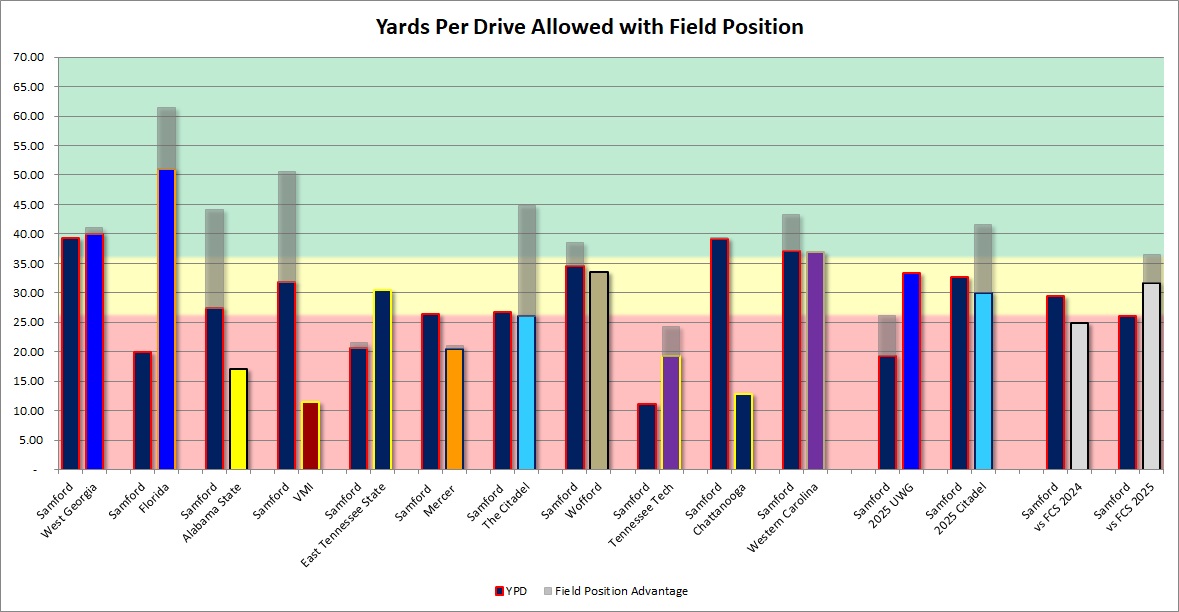
So far, the defense has been decent on yards per drive. They’ve been dealt bad scores with several non-offensive scores, including a fumbled fake field goal return and other short fields as well.
Defensive Overview Stats
The defense was on a year-to-year improvement until the DC left, but the new guy has kept solid numbers so far despite a whole new cast of characters. They are slightly better than last year in the red zone, forcing turnovers and remain close in other metrics.
| 2025 | 2024 | 2023 | 2022 | |
| Yards Per Drive | 31.71 | 27.88 | 33.58 | 35.58 |
| Points Per Red Zone Trip | 4.86 | 5.2 | 4.1 | 4.27 |
| Turnovers Per Game | 1.5 | 1.54 | 1.27 | 1.69 |
| Yards Per Play | 5.98 | 5.22 | 5.66 | 5.49 |
| Total Yards | 370.5 | 358.54 | 384.64 | 435.23 |
| % of Drives Scored | 39.13% | 32.52% | 33.33% | 38.36% |
| % Turnover Drives | 13.04% | 12.27% | 11.11% | 13.84% |
| 3rd Down % | 34.48% | 34.85% | 35.33% | 41.95% |
| 3rd or 4th Down % | 44.83% | 42.42% | 44% | 49.76% |
It’s been tougher on yards per play as they give up more big plays, but yards per drive isn’t too far off so far.
Defensive Passing Game
They’ve struggled to get sacks but have done a better job of generating interceptions. It’s a little better in terms of completion percentage, but has given up more per sack-adjusted pass attempt, despite having longer yards per attempt in raw form and a lower sack rate.
| 2025 | 2024 | 2023 | 2022 | |
| Completion % | 60.4% | 62.4% | 63.86% | 59.78% |
| Passing Yards Per Game | 199.5 | 236.55 | 204.82 | 261.54 |
| Yards/Att | 8.31 | 7.95 | 6.79 | 7.39 |
| Yards/Completion | 13.75 | 13.27 | 10.63 | 12.36 |
| Yards Pass Play Including Sacks | 7.84 | 6.50 | 6.24 | 6.71 |
| Sack % | 4% | 9.42% | 4.87% | 4.56% |
| INT % | 4% | 2.49% | 2.01% | 2.28% |
Defensive Run Game
Against the run, they’ve been worse than last year in raw statistics, but on par or better than the 2022-2023 teams.
| 2025 | 2024 | 2023 | 2022 | |
| Yards/Rush | 4.5 | 3.2 | 4.77 | 3.96 |
| Yards/Non-Sack Carry | 4.72 | 3.99 | 5.16 | 4.43 |
| QB Non-Sack YPC | 4.56 | 5 | ||
| Non-QB YPC | 4.83 | 3.84 | ||
| Run Play % | 59.68% | 53.98% | 53.28% | 53.2% |
However, the outlier chart shows they did decently on base carries, and three long runs in one of their two games really hurt them. They probably won’t match the consistent success that 2024 had with DC Adam Braithwaite, but they can disrupt a bit and will give up some bigger runs as a result.
Special Teams & Field Position
This team has been average in the return game, and while they’ve covered punts well, they gave up a touchdown to UWG on a kickoff return. They haven’t forced many touchbacks and typically have a disadvantage in field position, given their limited return game and turnover issues.
| 2025 | 2024 | |
| Kick Return Average | 19.86 | 24.23 |
| Punt Return Average | 13 | 6.88 |
| Opponent Kick Return Avg. | 43 | 24.78 |
| Opponent Punt Return Average | 1.5 | 8.65 |
| Average Field Position | 70 | 69.49 |
| Opponent Average Field Position | 67.63 | 69.96 |
| Touchback Kickoff % | 20% | 23.21% |
| Opponent Touchback Kickoff % | 40% | 26.71% |
Field position really hurt them in both losses against the Citadel and their loss to Tennessee Tech in 2024. Winning the field position battle helped them edge out Alabama State, Western Carolina and VMI.
Final Thoughts
- This team was better than I expected defensively, with basically a new starting unit and coordinator.
- The offense really cannot win the line of scrimmage. The defense tries to adjust its personnel to compensate for roster issues in terms of size. I do not expect Baylor to struggle here, and it’s a concern if they do.
- This team is not able to win the turnover battle, the explosive play battle or the line of scrimmage. I expect this to be among the easier FCS games for Baylor since I started covering these matchups when Robert Griffin III was in school. Only 2021 against Texas Southern might compare.
Follow @Baylor_S11 on X!