OSU's offense last year performed worse than I expected compared to what other P5's put up against their opponents. Run game probably to blame but their quick strike ability certainly impacts perception.
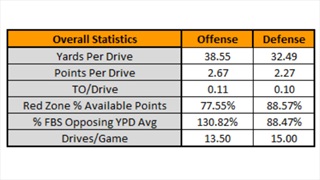
These statistics give an overview of the OSU Cowboys in 2016. This is taken from their games against FBS competition which in Oklahoma State's case is their games against Central Michigan and Pittsburgh.
The Cowboy offense has averaged 38.55 yards per drive and 2.67 points per drive with 0.11 turnovers per drive. The 38.55 yards per drive is 130 percent of what CMU and Pitt gave up to their 2016 opponents.
The Cowboys utilize a fairly high tempo and averaged 13.5 meaningful possessions in these two games. They do well in the red zone scoring 77.55 percent of their available points.
 SicEm365
Their defense has given up 32.49 yards per drive, 2.27 points per drive, and generated .1 turnovers per drive. Their yards per drive figure is 88.47% of what Pitt and CMU have averaged against their schedules overall.
The alarming statistic is their red zone defense where they gave up 88.57% of available points to opponents in their five opportunities to play defense there.
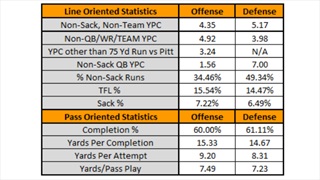
As for how they do in different aspects of offense and defense the Cowboys have struggled with line-oriented statistics. They have very high tackle for loss percentage, reasonably high sacks allowed percentage, and other than one outlier run against Pitt have a very low tailback yards per carry. Their low percentage of run plays makes perfect sense in light of this although it is very low for a team that has not had to play with a significant deficit on the scoreboard.
Their passing statistics are very good and features a high yards per attempt. Their yards per pass play (Yards per attempt that factors in sacks) is very high after facing two teams that play respectable defense. Their 7.49 is in the 82nd percentile when compared to the last two years of FBS teams. Their completion percentage is lower than I expected though.
Defensively the Cowboys have been effective but not elite at shutting down tailback carries. However, Pitt's quarterback and wide receiver carries were really able to hurt the Pokes. With that said, the Cowboys did a very good job of disruption up front with a solid sack percentage and a very good tackle for loss percentage.
 SicEm365
Their pass defense is not as strong and may miss the impact of graduated standout Kevin Peterson at corner. They have allowed 61% completions, 14.67 per completion, and almost as many yards per pass play as the OSU offense generates.
The Cowboys have not done well on third down but have held their opponents well. The Cowboys have averaged about eight yards better on starting field position and held a 20 yard advantage in penalty yards.
The Cowboys are capable in punt returns but kickoffs with this group aren't very loud for either side.
 SicEm365
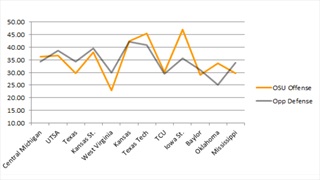
Obviously it's a limited sample size at this point in the season. In light of this I have included two charts of how OSU's yards per drive compares to what other Power 5 teams produced against their 2015 opponents.
The OSU offense averaged around 102% of what their opponents gave up to other Power 5 teams.
Their mixed results included performances like Tech, ISU, and OU where they outperformed the field and performances like Ole Miss, West Virginia, Texas, and Baylor where the Cowboys performed less favorably to the rest.
 SicEm365
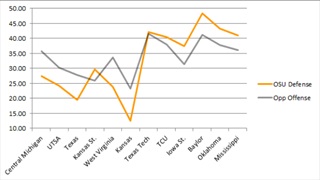
The Cowboy defense was a solid unit that held opponents to around 95% of what other Power 5 teams did.
Some of the better offenses they faced like Baylor, OU, and Ole Miss were able to significantly outperform their averages against OSU where other games like West Virginia, TCU, and Texas were held significantly below it.
It's a solid unit that had an up and down performance compared to other teams against these opponents.
Tomorrow we will begin our look at Oklahoma State's schemes.
The Cowboy offense has averaged 38.55 yards per drive and 2.67 points per drive with 0.11 turnovers per drive. The 38.55 yards per drive is 130 percent of what CMU and Pitt gave up to their 2016 opponents.
The Cowboys utilize a fairly high tempo and averaged 13.5 meaningful possessions in these two games. They do well in the red zone scoring 77.55 percent of their available points.
 SicEm365
Their defense has given up 32.49 yards per drive, 2.27 points per drive, and generated .1 turnovers per drive. Their yards per drive figure is 88.47% of what Pitt and CMU have averaged against their schedules overall.
The alarming statistic is their red zone defense where they gave up 88.57% of available points to opponents in their five opportunities to play defense there.
As for how they do in different aspects of offense and defense the Cowboys have struggled with line-oriented statistics. They have very high tackle for loss percentage, reasonably high sacks allowed percentage, and other than one outlier run against Pitt have a very low tailback yards per carry. Their low percentage of run plays makes perfect sense in light of this although it is very low for a team that has not had to play with a significant deficit on the scoreboard.
Their passing statistics are very good and features a high yards per attempt. Their yards per pass play (Yards per attempt that factors in sacks) is very high after facing two teams that play respectable defense. Their 7.49 is in the 82nd percentile when compared to the last two years of FBS teams. Their completion percentage is lower than I expected though.
Defensively the Cowboys have been effective but not elite at shutting down tailback carries. However, Pitt's quarterback and wide receiver carries were really able to hurt the Pokes. With that said, the Cowboys did a very good job of disruption up front with a solid sack percentage and a very good tackle for loss percentage.
 SicEm365
Their pass defense is not as strong and may miss the impact of graduated standout Kevin Peterson at corner. They have allowed 61% completions, 14.67 per completion, and almost as many yards per pass play as the OSU offense generates.
The Cowboys have not done well on third down but have held their opponents well. The Cowboys have averaged about eight yards better on starting field position and held a 20 yard advantage in penalty yards.
The Cowboys are capable in punt returns but kickoffs with this group aren't very loud for either side.
 SicEm365
The OSU offense averaged around 102% of what their opponents gave up to other Power 5 teams.
Their mixed results included performances like Tech, ISU, and OU where they outperformed the field and performances like Ole Miss, West Virginia, Texas, and Baylor where the Cowboys performed less favorably to the rest.
 SicEm365
Some of the better offenses they faced like Baylor, OU, and Ole Miss were able to significantly outperform their averages against OSU where other games like West Virginia, TCU, and Texas were held significantly below it.
It's a solid unit that had an up and down performance compared to other teams against these opponents.
Tomorrow we will begin our look at Oklahoma State's schemes.
Never miss the latest news from SicEm365!
Join our free email list
