S11 Review: How Baylor's Stats Stack Up So Far Against This Season and Last
As Baylor is most of the way through the year, let’s take a minute on this bye week to see how the different aspects of the team stack up statistically. How are they producing in raw numbers? How do they do relative to their schedule and compared to last year?
Below is a combination of charts and tables to help us understand the resume so far. The tables compare Baylor’s 2024 and 2025 performance against its P4 opponents with that of other P4 teams against the same opponents. The charts will feature a given metric, with Baylor in green, and either the opponent in their colors or other teams on their schedule in gray. The backgrounds will be shaded green, yellow or red, respectively, to indicate whether a metric is performing well, average or poor.
Offense
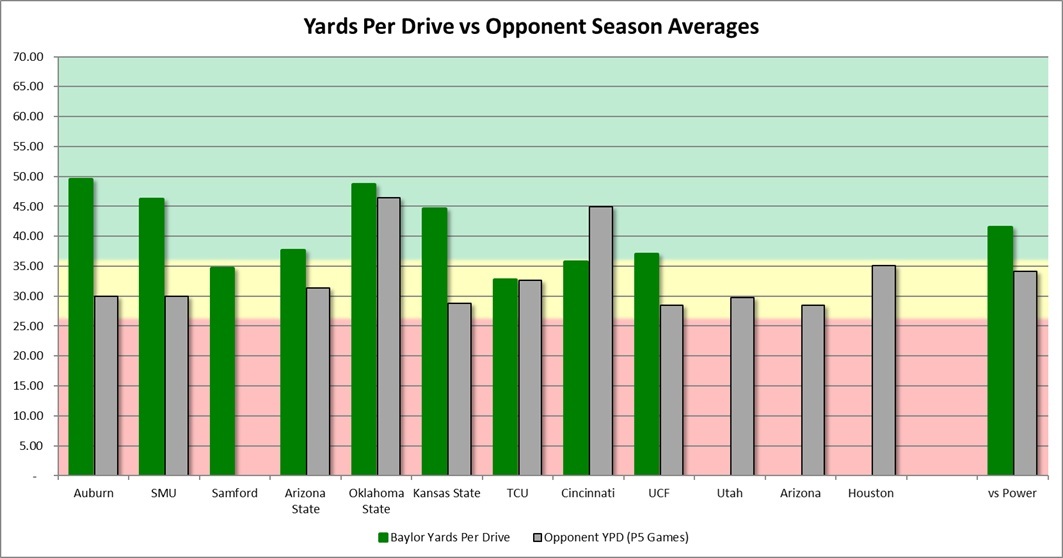
In yards per drive, the offense has outperformed what the opponent typically allows in every game except Cincinnati. In raw yards per drive, there wasn’t a low production outing. The season started off by ripping two otherwise solid defenses apart, and while the production has come a little back down to earth, it’s a far cry from what was the reality before Spavital arrived.
Offensive Overview Stats
The offensive unit is producing yards at a clip similar to its stretch run last year from the Texas Tech game on. The scoring drive percentage and third/fourth down rates are also very similar. However, things have slipped in terms of turnovers and the red zone. 10% more turnover drives and worse converting of drives into points combine to make it tough on Baylor.
| 2025 vs P4 | Other P4 vs Opponents | 2024 vs P4 | Other P4 vs 2024 Opponents | |
| Yd Drive | 41.54 | 33.82 | 36.83 | 35.39 |
| Points Per Red Zone Trip | 4.99 | 4.95 | 5.23 | 4.97 |
| Turnovers Per Game | 1.88 | 1.44 | 0.91 | 1.62 |
| Yards Per Play | 6.11 | 5.5 | 6.23 | 5.84 |
| Total Yards | 452.25 | 374.99 | 436.45 | 386.19 |
| % Of Drives Scored | 47.73% | 38.91% | 44.96% | 39.73% |
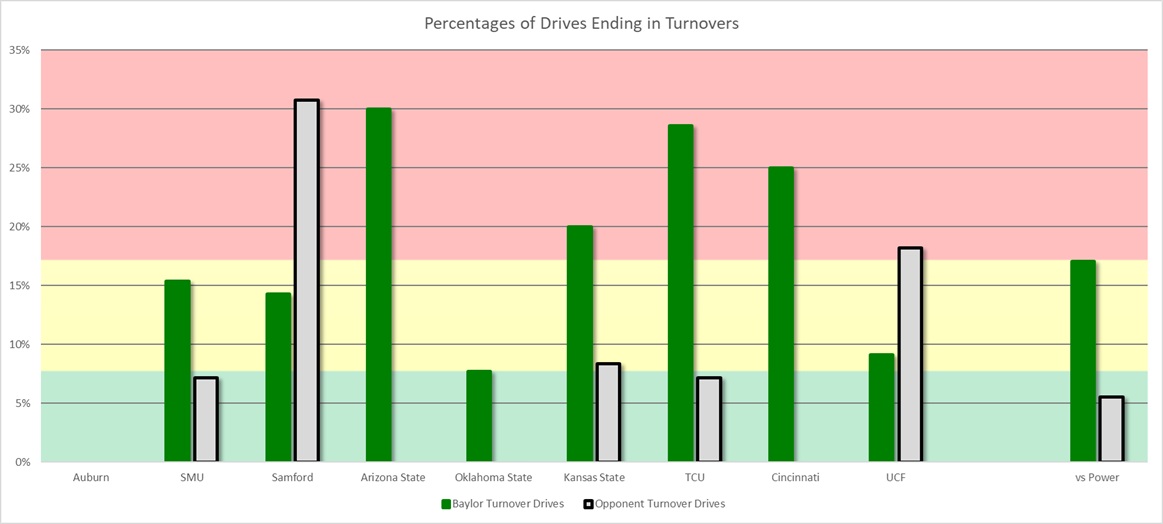
| % Turnover Drives | 17.05% | 12.95% | 7.75% | 14.65% |
| 3rd Down % | 40.35% | 39.23% | 41.83% | 41.3% |
| 3rd or 4th Down % | 55.26% | 48.31% | 53.59% | 48.63% |
The green bars show their third-down conversion rates. The light bars are stacked on top and show the added percentage they eventually converted on fourth down. So, of their third-down chances, what did they convert on the next two downs?
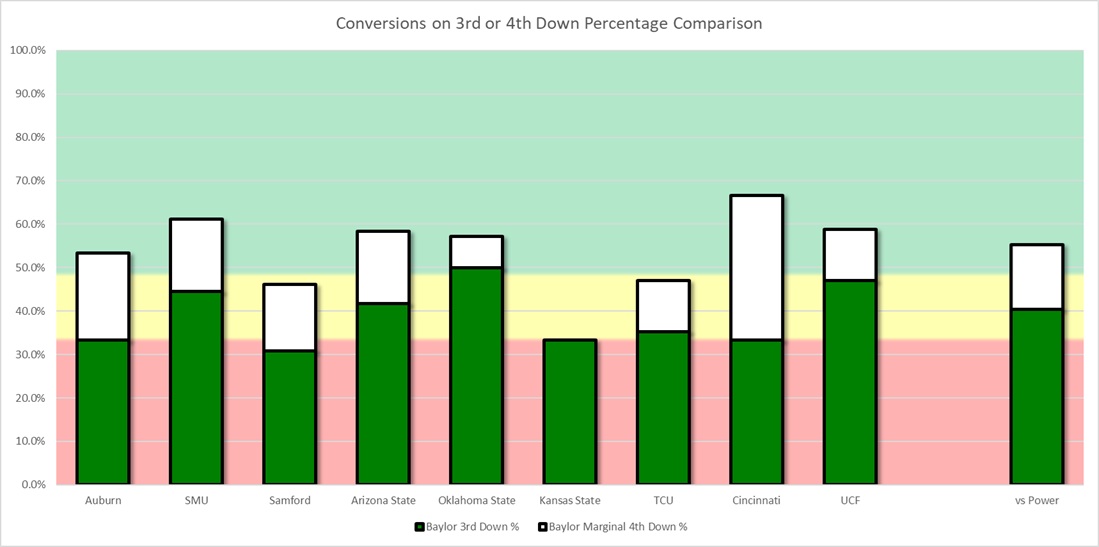
Baylor remains a team that isn’t easy to get off the field on third down or fourth down, but like last year relies a fair amount on fourth down to make that a reality. Baylor was very reliant on it at Cincinnati, as it was against Auburn. KSU was the low mark on this metric but only had 9 third down attempts the whole game vs an average of 15 in the other P4 games so going 3-for-9 wasn’t great on third down and going 0-for-1 on fourth was bad but in the context of the game it didn’t really have an outsized impact as Baylor scored on 5 of it’s 10 drives.
The offense generally avoids losses on runs or completions, and surprisingly, this past weekend was the only notable deviation from that.
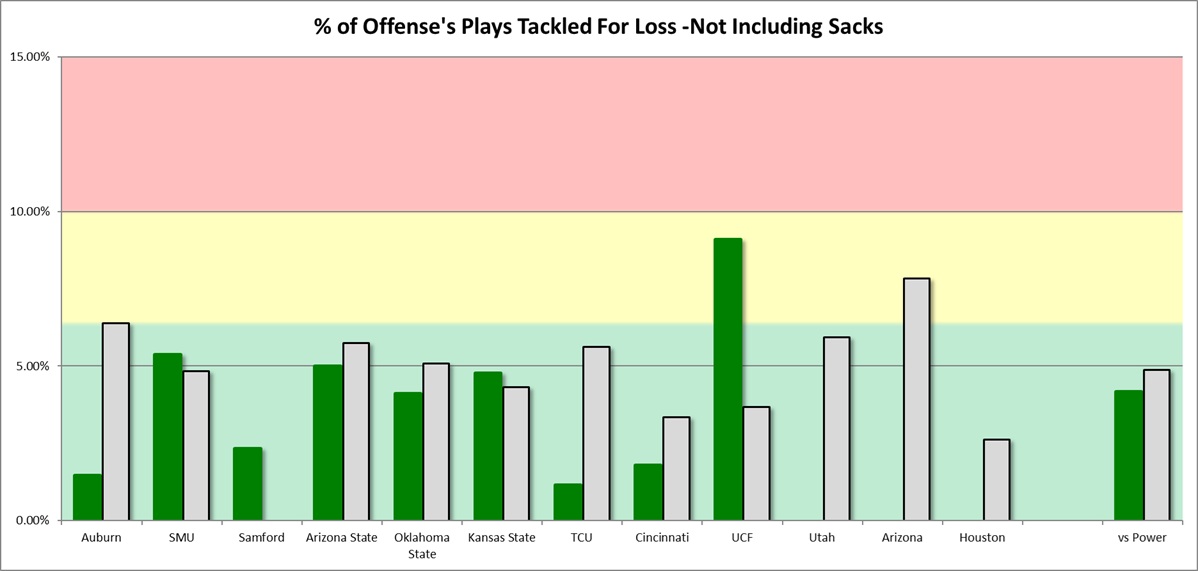
The big issue has been turnovers. Baylor has given it up much more than their opponent, and it was dramatic in the ASU, TCU, KSU, and Cincinnati games.
Offensive Passing Game
The passing game is firing very well as a high-caliber senior QB would be expected to do. Baylor is positive on each of the metrics below despite throwing it nearly 60% of the time.
| 2025 vs P4 | Other P4 vs Opponents | 2024 vs P4 | Other P4 vs 2024 Opponents | |
| Completion Percentage | 62.92% | 60.45% | 60.11% | 60.27% |
| Yards/Att | 7.81 | 7.11 | 7.95 | 7.41 |
| Yards/Completion | 12.41 | 11.76 | 13.23 | 12.3 |
| Yards/Pass Including Sacks | 7.18 | 6.14 | 7.22 | 6.52 |
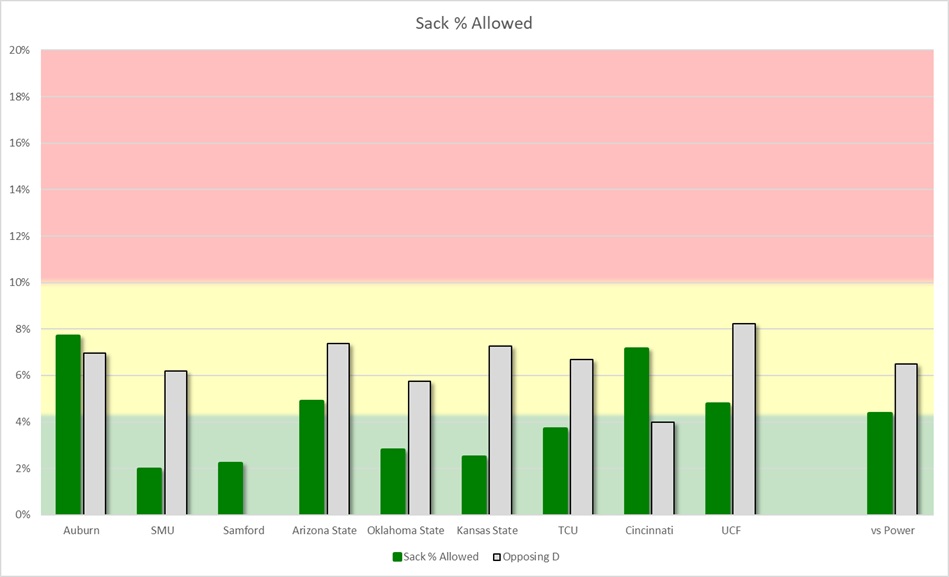
| Sack % | 4.36% | 7.23% | 4.5% | 6.1% |
| INT % | 1.45% | 2.72% | 2.12% | 3% |
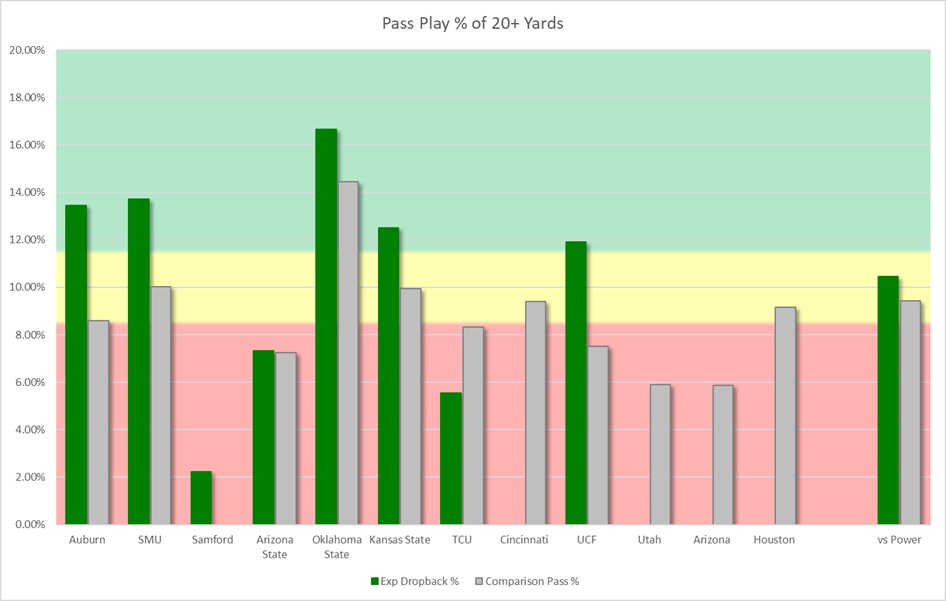
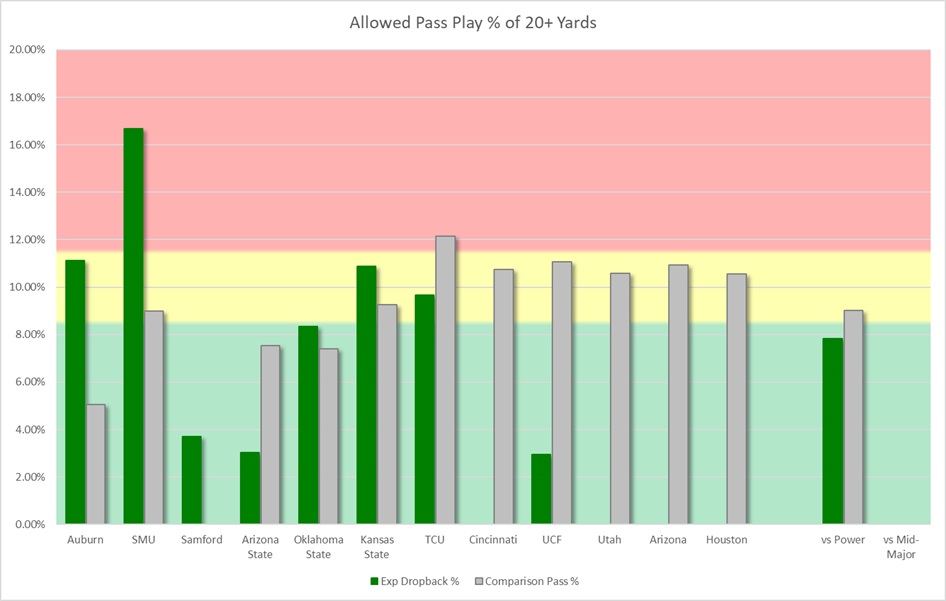
Baylor is also adept at hitting pass plays of 20+ yards. They were limited in this against ASU, Cincy, TCU, and randomly Samford, but otherwise have ripped apart several solid defenses and a couple bad ones.
Baylor generally avoids sacks well. Auburn and Cincinnati had success, but basically nobody else outperformed their usual against Baylor here.
Offensive Run Game
The running game has taken a notable step back. The opposing defenses are stopping this year’s run a little better than 2024’s, but it’s a big step back. This has also taken the offense from a 50/50 run-pass balance into a heavier pass reliance.
| 2025 vs P4 | Other P4 vs Opponents | 2024 vs P4 | Other P4 vs 2024 Opponents | |
| Yards/Rush | 3.99 | 4.02 | 4.71 | 4.45 |
| Yards/Non-Sack Carry | 4.63 | 4.81 | 5.27 | 5.16 |
| QB Non-Sack YPC | 4.76 | 5.48 | 7.12 | 6.21 |
| Non-QB YPC | 4.64 | 4.84 | 5.27 | 5.12 |
| Run Play % | 41.89% | 48.31% | 50.97% | 50.23% |
Below is an outlier chart where the combined stacked bars vertically equal the offense’s non-sack yardage per carry from the running back or quarterback positions. The stacked white bars show how a small number of “outlier runs” of around 15-20 yards or more contribute to the quarterback or tailback yards per carry average.
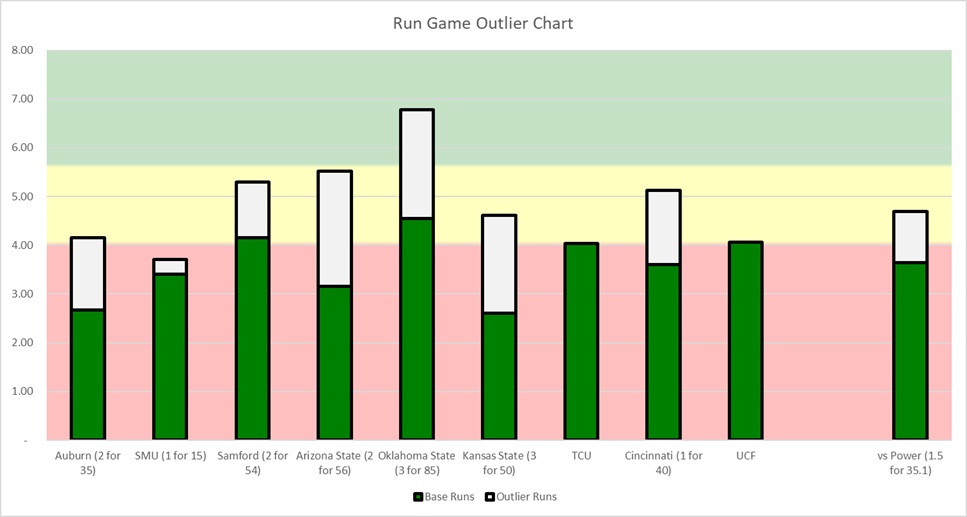
What we see is that despite the defense having to largely focus on the pass first, the run hasn’t hit many big plays. And while most of the carries have been consistent statistically, overall, the running game has not been able to reliably grind out yards in tougher games.
Defense
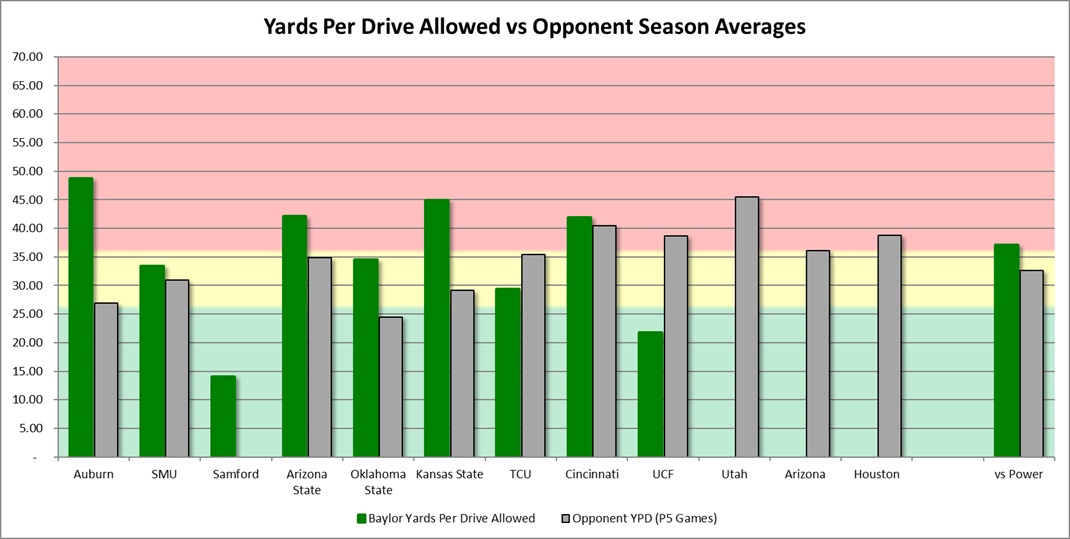
Last week’s surprising domination of UCF’s offense notwithstanding, Baylor has struggled in yards per drive almost every week. The most concerning game still is the week one effort against a frankly bad Auburn offense that can’t really pass well and was able to run against favorable looks most of the night.
Defensive Overview Stats
The defense has regressed relative to last fall. Yards per drive is better, but the opposition is worse. The scoring drive rate, conversion rates, red zone points, and lack of forcing turnovers all stand out. The yards per play is down, signaling fewer big 20+ yard plays, but third/fourth down struggles place the Bears in a tough spot regardless.
| 2025 vs P4 | Other P4 vs Opponents | 2024 vs P4 | Other P4 vs 2024 Opponents | |
| Yards Per Drive | 37.1 | 33.89 | 39.34 | 35.25 |
| Points Per Red Zone Trip | 5.1 | 4.82 | 4.89 | 4.93 |
| Turnovers Per Game | 0.63 | 1.39 | 1.55 | 1.68 |
| Yards Per Play | 5.7 | 5.56 | 6.05 | 5.66 |
| Total Yards | 406.88 | 369.01 | 420.09 | 377.57 |
| % of Drives Scored | 47.25% | 38.54% | 42.62% | 40.13% |
| % Turnover Drives | 5.49% | 12.56% | 13.93% | 15.18% |
| 3rd Down % | 42.99% | 37.77% | 37.84% | 41.28% |
| 3rd or 4th Down % | 48.6% | 45.8% | 49.32% | 48.86% |
The green bars show their opponent’s third-down conversion rates. The light bars are stacked on top and show the added percentage they eventually converted on fourth down. So, of their third-down chances, what did they convert on the next two downs?
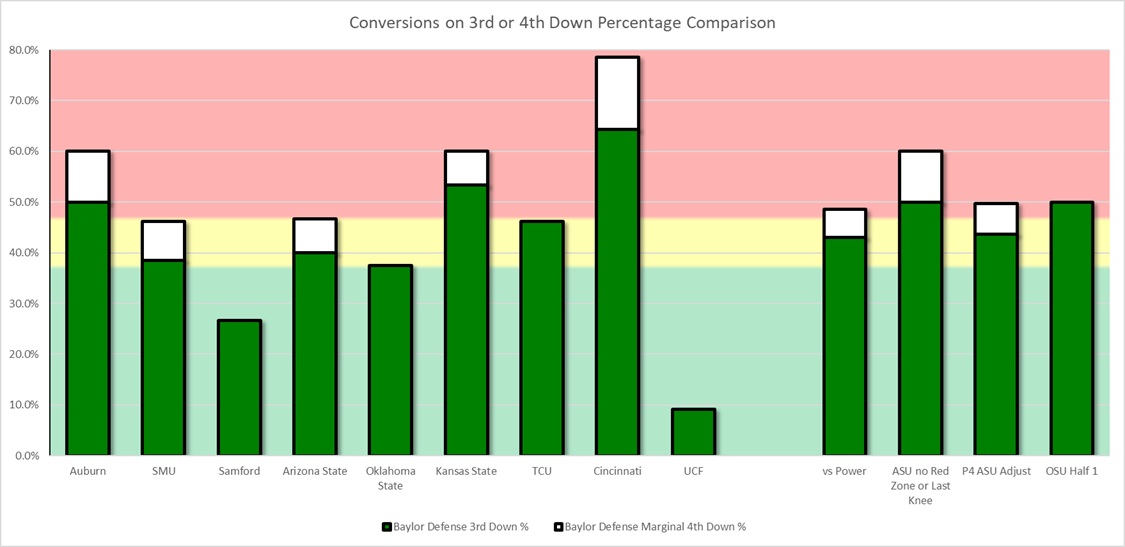
This team does a great job avoiding the big play, but outside of the UCF game and the second half of the OSU game, teams have been able to move it down the field for lengthy drives. Arizona State was stuffed in the red zone but largely did what it wanted between the 20s. Cincinnati was almost a perfect show of futility in getting them off the field. Frustratingly, teams haven’t had to get to 4th down to do much of it.
This chart takes the combined rate against what the opponent does against other P4s. Even by this metric, Baylor is routinely struggling even against offenses that are bad at converting.
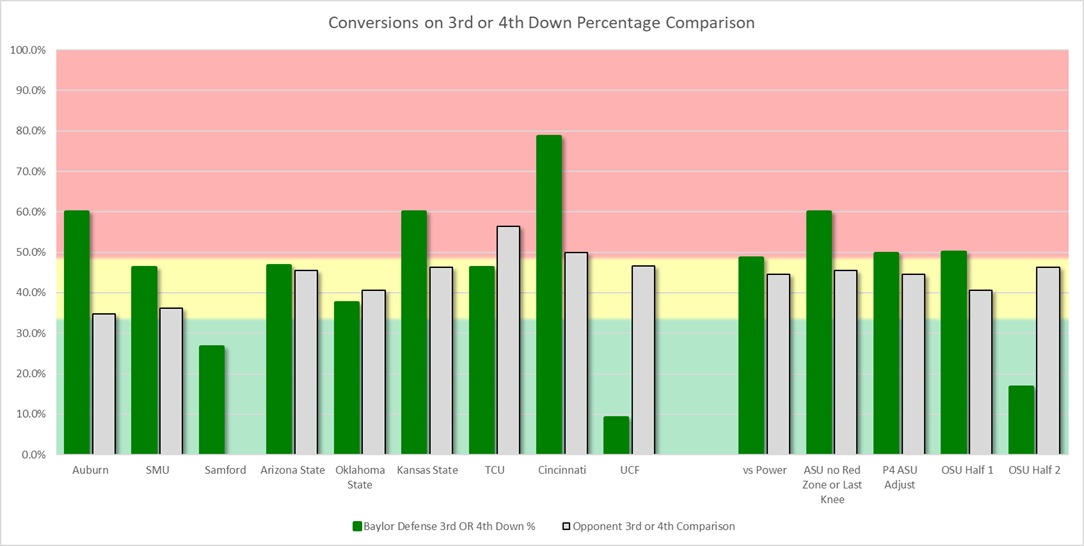
Auburn, Cincy, SMU, and KSU stick out as notable struggles, and ASU joins them when red zone or kneeldowns are ignored. Half one against OSU was also rough in this metric.
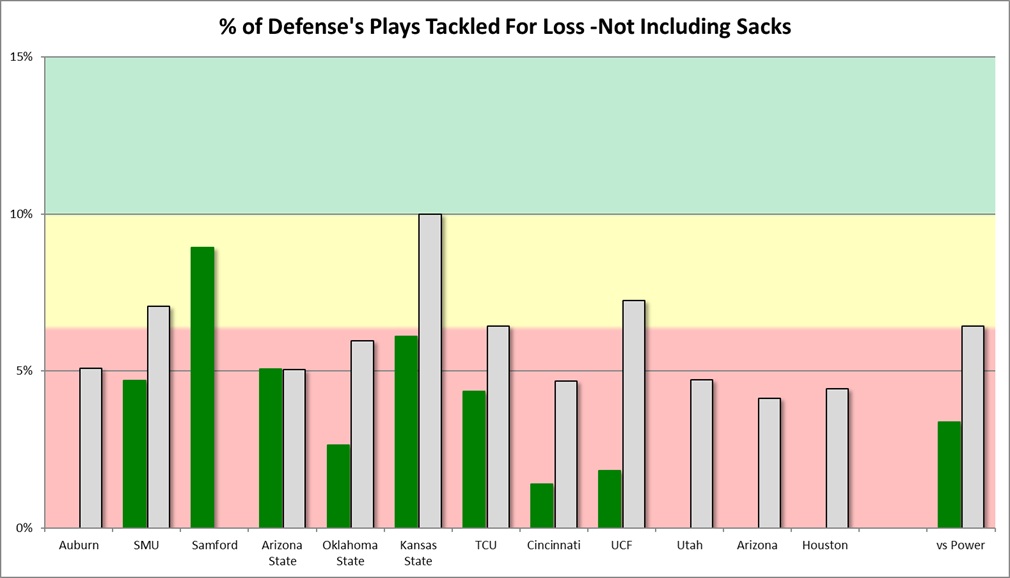
Part of the issue is that Bayor has not inflicted a lot of negative plays on anybody other than Samford, and the rest of the schedule doesn’t have many opponents who allow that often.
Defensive Passing Game
Against the pass, Baylor keeps the yardage down, the completions up, and struggles to get sacks or picks.
| 2025 vs P4 | Other P4 vs Opponents | 2024 vs P4 | Other P4 vs 2024 Opponents | |
| Completion % | 63.71% | 60.92% | 61.62% | 61.21% |
| Yards/Att | 7.06 | 7.17 | 7.94 | 7.32 |
| Yards/Completion | 11.09 | 11.77 | 12.89 | 11.95 |
| Yards Pass Play Including Sacks | 6.69 | 6.28 | 7.14 | 6.54 |
| Sack % | 2.75% | 6.83% | 5.37% | 5.29% |
| INT % | 1.57% | 2.52% | 3.07% | 3.12% |
They’ve been decent on 20+ yard pass plays with only 2 in one of the “bad” outings against Auburn. SMU and KSU were really the worst here, and Auburn was more of a function of throwing rarely with one blown assignment.
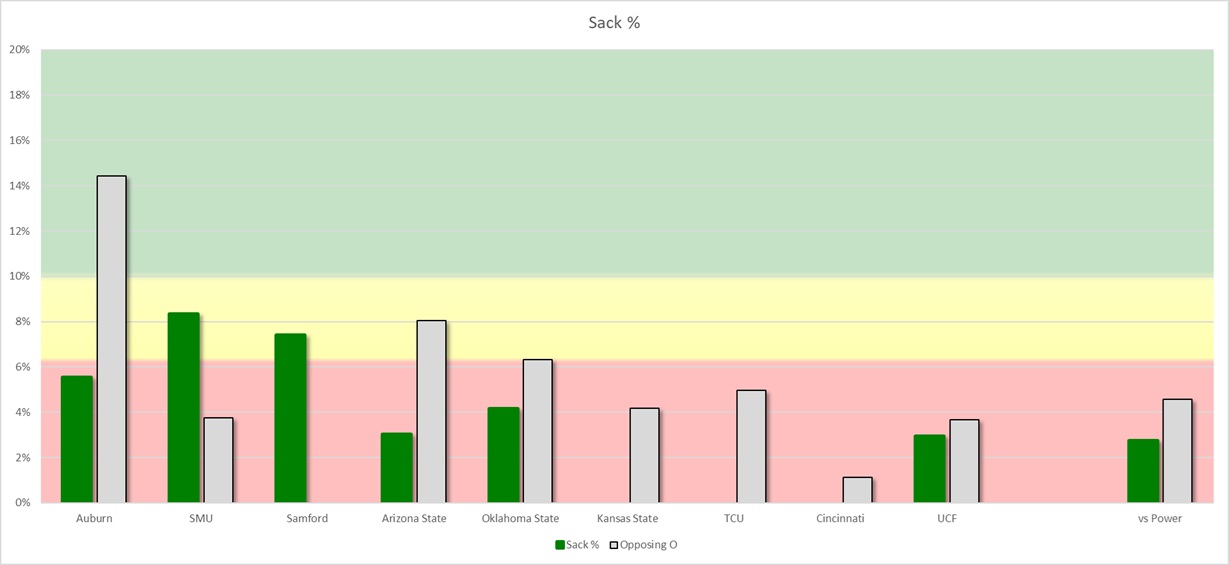
However, if you never get to the QB, they get consistent yards, and the defense’s ability to avoid the big play is minimized. Other than SMU and Samford, it’s been tough for BU to get home, and one of those SMU sacks may have been the referee.
Defensive Run Game
Against the run, it’s been worse than their schedule and worse than last fall on non-QB carries. Teams are running much more vs BU than others.
| 2025 vs P4 | Other P4 vs Opponents | 2024 vs P4 | Other P4 vs 2024 Opponents | |
| Yards/Rush | 4.65 | 3.99 | 4.27 | 4.05 |
| Yards/Non-Sack Carry | 4.9 | 4.75 | 4.91 | 4.71 |
| QB Non-Sack YPC | 5.96 | 5.66 | 6.7 | 5.3 |
| Non-QB YPC | 4.78 | 4.71 | 4.53 | 4.8 |
| Run Play % | 55.34% | 46.8% | 48.82% | 47.86% |
Below is an outlier chart where the combined stacked bars vertically equal the opposing offense’s non-sack yardage per carry from the running back position or quarterback position is charted. The stacked white bars show how a small number of “outlier runs” of around 15-20 yards or more contribute to the tailback yards per carry average.
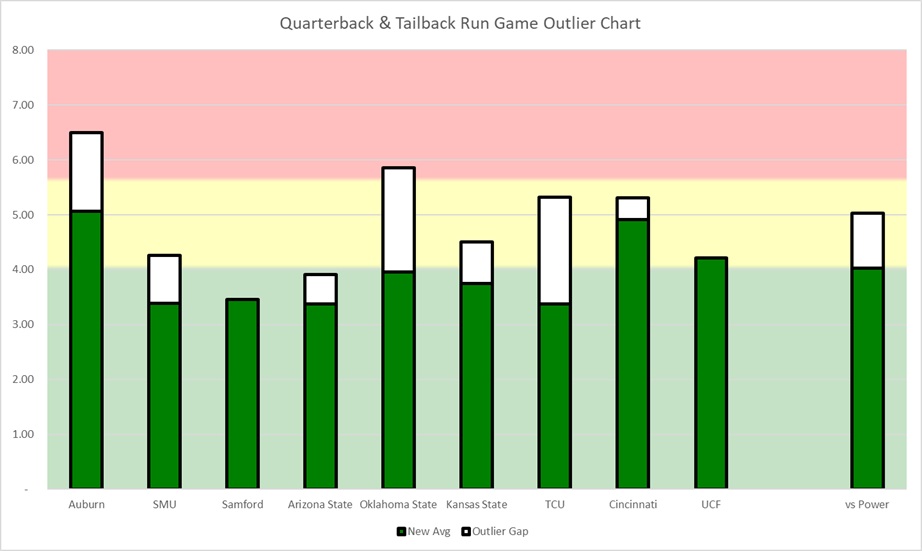
What we see here is — apart from SMU, which struggles to run it and to an extent, ASU — the run defense has been struggling. Auburn and Cincinnati were high yardage-per-carry teams and also consistently got yards, which is the worst of both worlds. OSU and TCU were decent down-to-down, but long runs of 33 and 65 yards spike the average.
Special Teams & Field Position
The Bears have a solid return unit that narrowly outpaces their opponent coverage unit averages, but hasn’t been as lethal returning punts as last year. Kick coverage is worse than in 2024, while punt coverage is better. Field position has flipped from a 3-yard advantage to a 3-yard disadvantage.
| 2025 vs P4 | Other P4 vs Opponents | 2024 vs P4 | Other P4 vs 2024 Opponents | |
| Kick Return Average | 21.92 | 20.07 | 21.8 | 19.76 |
| Punt Return Average | 6.75 | 5.5 | 22.91 | 9.08 |
| Opponent Kick Return Avg. | 22.3 | 21 | 19.86 | 20.68 |
| Opponent Punt Return Average | 3.5 | 6.71 | 5.81 | 9.19 |
| Average Field Position | 71.98 | 71.1 | 69.55 | 71.13 |
| Opponent Average Field Position | 68.21 | 70.83 | 72.32 | 70.43 |
| Touchback Kickoff % | 50% | 59.24% | 57.58% | 48.62% |
| Opponent Touchback Kickoff % | 46.94% | 55.56% | 40% | 49.64% |
Below is a comparison of yards per drive with the average advantage in starting field position stacked on top of the team that won that battle. It provides an idea of the “hidden yards” and how they contribute to success.
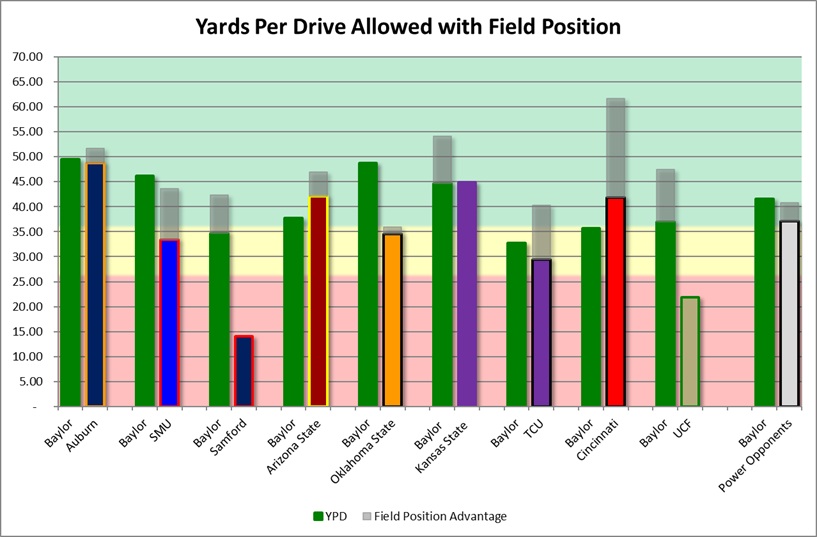
Field position really was a disadvantage vs. SMU, ASU, TCU, Cincinnati, and, to a lesser extent, Auburn. It probably played a beneficial role in the KSU win.
Final Thoughts
- This offense is really strong in the air and in moving the ball upfield, but the issues with turnovers need to be fixed.
- The run game is not where it needs to be, and getting that fixed is one of the best things the offense can remedy, as it also helps the red zone issues.
- The defense does a solid job avoiding big plays, but the small plays are adding up too fast. They need to risk some bigger plays to inflict some big plays of their own and get off the field. You can’t consistently win if your opponent is converting half the time you get past second down, and you aren’t turning them over or getting them off schedule. Bend but don’t break can work, but you have to get off the field with plays of your own.
- The Bears have a tough trio of games to end the year. Win one for a bowl, and it’s not certain they will.
Follow @Baylor_S11 on X!