When realignment comes around, fans run to TV ratings as television value is the motor behind much of the saga that has been on-going for seemingly forever. These comparisons usually end up very flawed for a number of reasons.
I’ve addressed flawed comparisons before.
In the interest of more data and understanding, let’s take a look the way that many of these articles fail to account for the network a game appears, as well as the competition across networks in the time slot, and how those two factors can skew the numbers wildly.
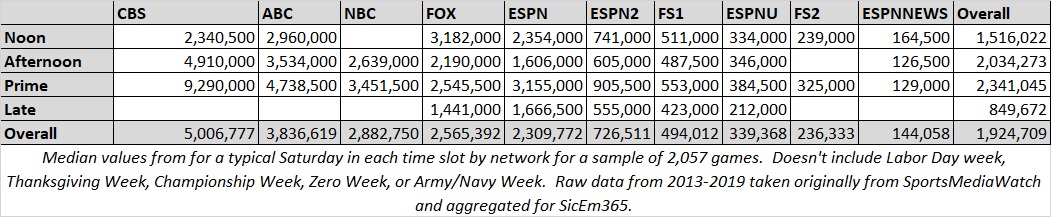
Below is the look at the median (middle value) for what a typical Saturday game on major networks in one of the four major time slots would be expected to generate. A prime time ABC game is expected to garner nearly ten times as many viewers than what an afternoon game on FS1 would.
Noon is defined from the range of 11:00-1:30 PM ET while afternoon is 2:00- 5:00 PM ET and prime time is 5:30-9:30 PM ET. Late games are defined as anything after that.
The Power of Networks
An extreme example of this was in 2009 where despite ESPN’s College Gameday going to Provo for a big 2009 matchup between a BCS buster TCU team and a strong BYU team that upset OU in the opening weekend the TCU-BYU game was carried by the Versus network in prime time but got little attention. The result was a paltry 261,000 viewers in spite of one unbeaten against a one-loss team with College Gameday in town for national attention. Two years later a less interesting 6-2 vs 5-2 matchup got a Friday prime time spot on ESPN tallied 1.4 million viewers with the exact same schools.
Similarly, Texas-OU averaged 5.5 million viewers when network TV stations like FOX or ABC carried it in the noon time slot from 2011-2021, but the one FS1 appearance generated just 2.78 million viewers.
Oregon-USC averaged 3.9 million viewers on FOX in prime spots but averaged just 1.57 million on ESPN in the two appearances their matchup had (1 Noon, 1 Prime).
The network assignment and time can skew things dramatically so I organized these windows into days of the week, network carrying the game, time slot, and whether a unique week like championship week, Army/Navy, Labor Day week or Thanksgiving week was occurring as those can impact numbers.
Below are the top 25 windows with more than one game in the window once this all was split out along with the average number of competing games I found in nationally rated data.
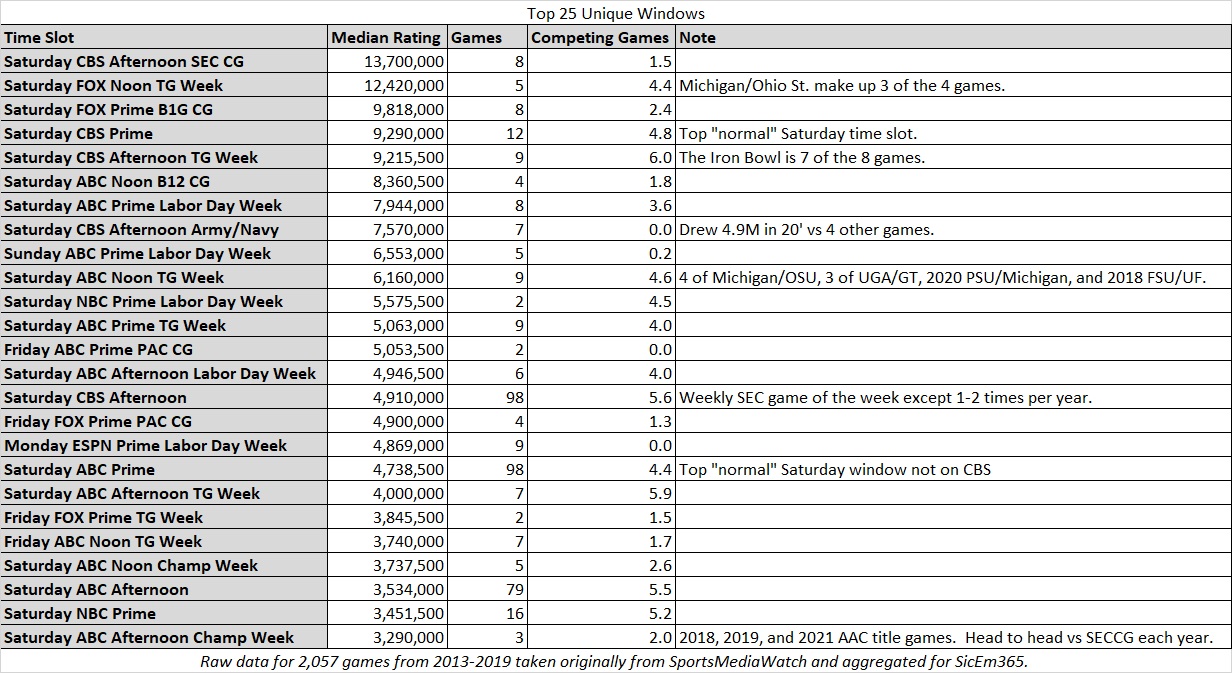
The conference title games obviously do very well but recurring spots for rivalries like Ohio State-Michigan and the Iron Bowl go crazy annually because it’s appointment TV for entire regions of the country and usually carry national title implications for one or the other.
This chart once again shows how different the windows behave. For instance, an ABC game on Saturday afternoon can be expected to receive almost 1.5 million more viewers on Labor Day weekend than on a typical Saturday. On championship week it tended to do less as it was up against the SEC title game which is the top window all year. Ideally analysis would account for these variances.
Similarly, an ABC prime time game can vary as a Saturday prime time game in a normal week gets 4.7 million while the unopposed Labor Day Sunday spot on that placement gets nearly 6.6 million.
Other than a couple of entries where some heavyweight matchups annually show up or where the SEC game of the week lives you have a lot of relatively low competition windows ranking among the most favorable. These are predominantly on network stations (ABC, ESPN, FOX, NBC, CBS) or ESPN which is the primary ratings-generator on cable. Networks that everyone watches do well but they do even better when they either have elite brands, national stakes, or if they face fewer games in their time slot to divide a potential casual audience.
Here is a look at how the windows rank on a “typical” week. This excludes Labor Day, Championship week, Zero week, Thanksgiving week, or Army-Navy week which can dramatically impact competing games and as a result impact viewership expectations.
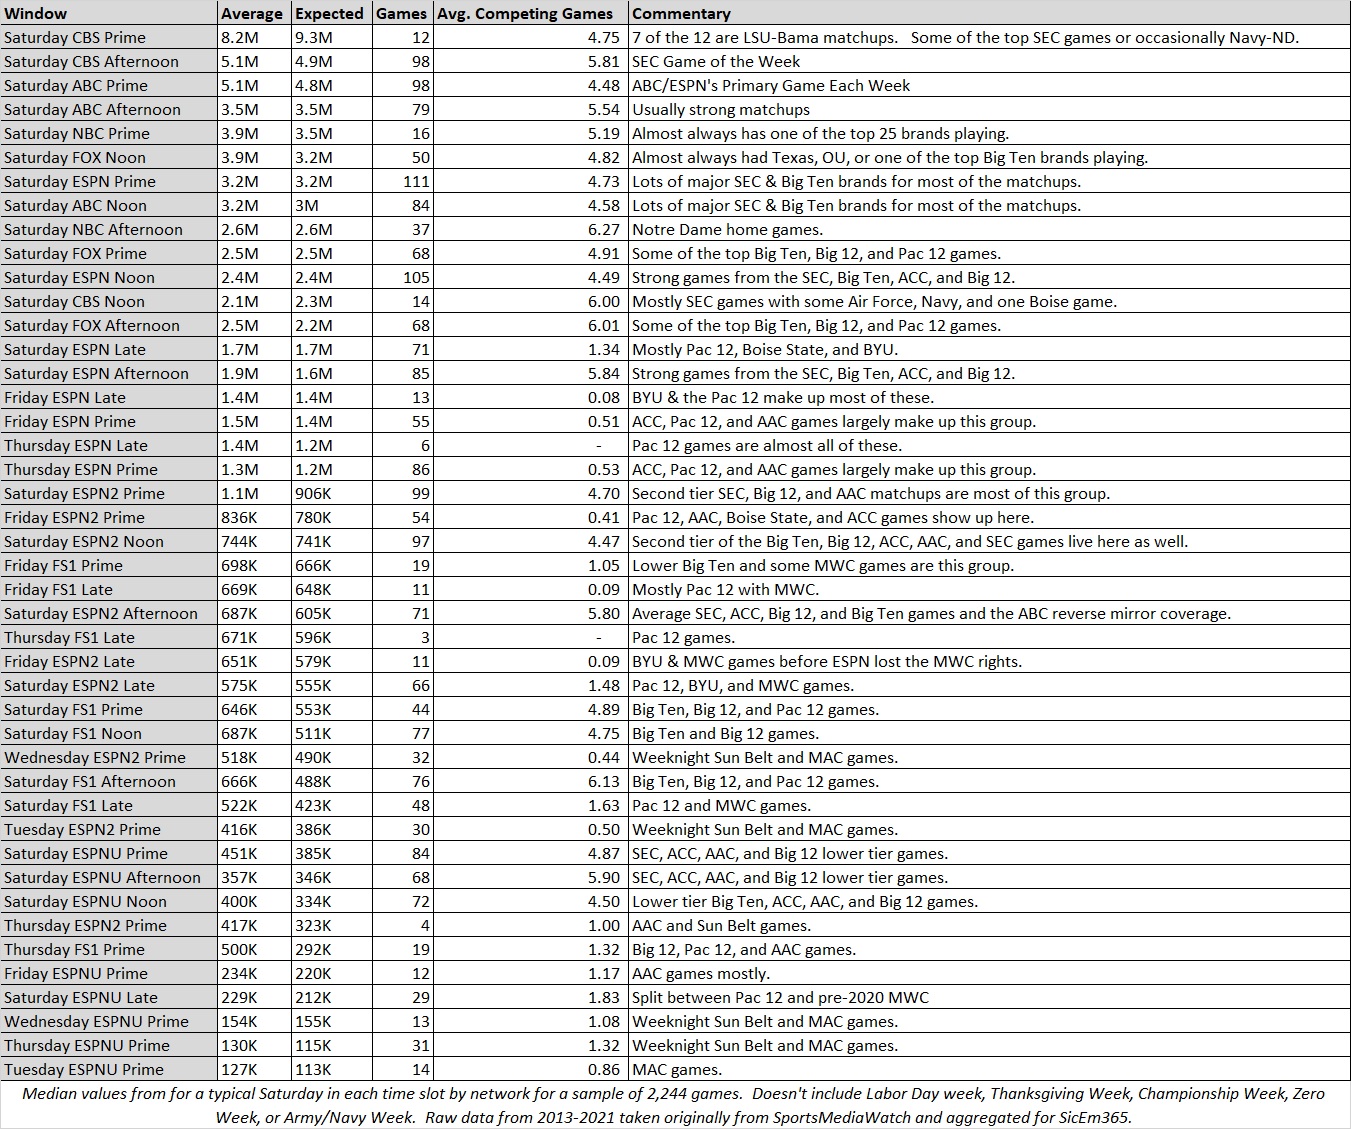
This shows the late windows and Thursday/Friday windows do well despite having what I would consider to be much weaker matchups than its same network afternoon or noon counterparts. Generally, windows with low competition are doing better than crowded ones unless big brands are pumping things up like the ESPN Noon window, or most notably the SEC on CBS.
About Jon Wilner’s Claim That “TV ratings suggest the Pac-12 has an advantage”
One article people have asked about since my last ratings article is Jon Wilner’s piece where he tallies how many games that each of the remaining Big 12 and Pac 12 have that hit either 1.0 or 2.0 in ratings once Texas and Oklahoma or USC & UCLA are omitted.
Since the context for these numbers matches closely with this article, I’ll elaborate.
Wilner has a long track record of reputable reporting and his numbers were in the ballpark of what I saw in my data with slight variances, but lacked the context that I believe ultimately makes his comparison pretty irrelevant. My goal here isn’t to attack him, his reporting, or anything of the sort. I intend to add more data and context to the conversation.
Insights get better with more data and context, not less.
In his piece, Wilner reported 30 1.0 games for the Big 12 and 64 for the remaining Pac 12. He reported 17 2.0 games for the Pac 12 and nine for the Big 12. Looked at without the proper lens, this would be a giant indicator of an advantage for the remaining Pac 12. But once we look at the network appearances, competing games, and other factors, it boils to a pretty equal comparison.
Neither conference had 1.0 or 2.0 rated games on networks other than ABC, NBC, CBS, FOX or ESPN. Even solid matchups tend not to draw that well on FS1, ESPN2, ESPNU, and similar.
Both leagues had a similar percentage of games on the network channels plus ESPN reach the 1.0 or 2.0 ratings. In total, 62% of the Pac 12 games and 58% of the Big 12 games on those channels went for 1.0 ratings. Additionally, 18% of Pac 12 games and 17% of Big 12 games went for 2.0 ratings.
Each league converted opportunities on these networks at a similar rate, and the two are pretty even here.
After departing schools are omitted, the remaining Pac 12 schools had 26 fewer network station appearances vs. UCLA than UT and OU against the remaining eight Big 12 teams. The number changed to 19 fewer once ESPN is included.
Both leagues had between 70 and 80 network appearances and the Big 12 remaining schools had 37 ESPN games with games against Texas and OU included while the remaining Pac 12 had 15 ESPN games before the after-dark slot and 59 late. T overall comparison was reasonable when all were included but the disparity is about to get massive when these are excluded.
Part of this distortion was because everyone plays everyone in the Big 12 meaning UT and OU occupy two of the games on each schedule. UCLA and USC occupy a smaller percentage of Pac 12 games as each plays eight of the remaining ten per year.
Another factor was OU was very good while UCLA was not, meaning networks were less motivated to put the Bruins in favorable windows while being extremely motivated to put the Sooners on. UT and USC largely offset as disappointing blue blood brands with 1-2 strong seasons during his sample.
Between this and the division format, any game with Big 12 title implications had a significant representation of OU while the Pac 12 North race could have games determining title game participants without the departing two factoring in much at all. This means more motivation to put Wazzu, Oregon, Washington and Stanford on without the departing two but any team factoring into the Big 12 race naturally involved a larger dose of OU and Texas due to selection procedures.
Where do the counts stand after the four departing schools are omitted? The Big 12 had 26 appearances on network stations and 26 on ESPN. The remaining Pac 12 had 48 network appearances and 55 on ESPN, roughly double the Big 12 with a combined 103 vs. 52. Since the two convert appearances on those channels at a similar rate you should expect a gap now of about double which is what Wilner’s numbers approximated. When one side has almost double the ABC/NBC/CBS/FOX appearances than the other side has on that AND on ESPN it’s comparing apples and oranges.
For context, that’s around 10 broadcasts on a network station or ESPN per year for the remaining eight — half of what AAC schools averaged over the past three seasons and neither league figures to be that low on its next deal. The Pac 12 doesn’t figure to and neither does the new Big 12 given that the Big 12 just took the top three schools driving most of that AAC contract value plus BYU who had another four per year. It’s an unrealistic margin on appearances that invalidates the comparison.
Low Competition Windows
The Pac 12 schools have another advantage: low competition windows. Remember above how TV windows with lower competition can benefit with viewers? The Pac 12 had 59 games where the broadcast was up against three or fewer games on nationally rated networks. The remaining Big 12 teams? Only 13. That’s a huge factor. Not only were there twice the opportunities on networks capable of getting those ratings, but the league also had very little competing for over half of its content while the Big 12 only had such a luxury 25% of the time. The Pac 12 had just about half of its 1.0 ratings occur in these scenarios.
Such a disparity in number of appearances on relevant networks and low competition windows makes for a poor comparison given they converted network & ESPN appearances in general into 1.0 and 2.0 at a similar rate.
Even Using His Metrics The “New” Big 12 Has Roughly The Same Numbers
One item Wilner doesn’t mention that makes for an even comparison is the impact of adding in the new four schools to the Big 12.
Much like the Pac 12, these teams benefited from some low competition windows and commanded the lion’s share of the ABC & ESPN appearances in the AAC’s contract and of course BYU’s independent deal. As a quartet I counted six appearances where the teams had a reported rating of 2.0 or more on Sports Media watch and 30 with 1.0 rating or had over 1.7 million estimated viewers. This is not including regional ABC coverage where the percent of the country getting the game on ABC/ESPN2 would be below 3.5 million or 1.7 million respectively.
Note: The viewers were utilized for games with no rating listed but viewers reported. Viewer total was also used for estimating ABC/ESPN2 regional coverage where the percentage of the nation’s TV sets getting a game on ABC would get that percentage of the ABC viewers and the estimated percentage of ESPN2 viewers for the parts of the country getting the game on ESPN2.
Add that to the remaining Big 12 teams and you get 15 2.0 ratings compared to the Pac 12’s 17, and 60 1.0 ratings for the Big 12 compared to the Pac 12’s 64. This also brings the number of opportunities on network stations & ESPN more even (103 vs 118 is much closer than comparing 103 to 52) and the number of low competition windows on those networks almost even (59 to 53).
Much like the other analysis I did in response to Mandel’s article, we end up with any difference at this point amounting to splitting hairs. You can argue the Pac 12 is ahead slightly but you can also argue the new four are undervalued while playing Tulane, Temple and Tulsa for many of those opportunities that would have gone bigger against WVU, Tech, BU, TCU or ISU instead. Each has several arguments, but the counts end up close enough to not draw enough of a difference to make any distance between the two.
Overall, Wilner’s article doesn’t really look at television window, network, or the likelihood of either to be unchanged as the after dark spot is likely to compete with USC and UCLA going forward either with them on FS1 splitting viewership or taking the ESPN windows that produce 1.0 ratings from them.
I do believe it was an honest reporting of the numbers he saw. but I also believe it lacks context and upon closer inspection the data does not tell the story he claims it does. If it was a good approximation of television value then the AAC would have had an advantage over the remaining Big 12 last summer, which it clearly did not with the Big 12 adding its best teams last summer. The AAC also had more 1.0 and 2.0 games due to similar factors yet it didn’t matter much in valuation.
Wilner’s argument would be reasonable if the television windows, competing games, and number of appearances on relevant networks were similar but they clearly are not here.
The numbers are similar when the new additions are added in which ends up at a pretty close comparison which matches the analysis in my prior article. None of this discussion between media outlets and writers will determine if we see further realignment between the two leagues.
The television networks have more extensive, detailed, and informative data than what is publicly available and their own business needs will determine what happens along with whatever the Big Ten or SEC do regarding potential expansion. If FOX, ESPN, CBS, NBC, or another major player want to bankroll something to happen or not happen, it will likely go that way in most scenarios including potentially bankrolling further expansion from the Big Ten or SEC.