New Member Special: Try SicEm365 Premium for $5.00 until Feb. 6
In this first part of our preview we take a look at KU’s stats this season.
Les Miles Attempts Another Turnaround On The Plains
In the offseason Kansas made a splash hire by grabbing Les Miles who is well known for his decade at LSU where he won the 2007 national title and two SEC titles. However he also has the claim to fame of turning Oklahoma State around from a group that had been 7-17 in the three years prior into a team that went to three bowls in the final three seasons he was there during his four year tenure with solid assistant coaches like Mike Gundy who succeeded him as Head Coach in Stillwater.
The first year has shown some ups and downs. KU struggled out of the gate to beat FCS Indiana State and then lost to Coastal Carolina before going on the road to blow out Boston College from the ACC. They don’t have the wins yet but they gave Iowa State and Texas all they wanted and knocked off Tech. With that said it’s still a rebuild and their yard per drive comparison below shows that they are not gaining yards like they are allowing them. They’ve had some big offensive games but are a work in progress on defense.
Offense
Offense is the strong suit for the Jayhawks and they have had some big games, especially after Brent DeArmon took over playcalling against Texas. The following chart shows their yards per drive compared to what their opponents allow other P5 offenses to generate. (Coastal Carolina didn’t play any P5 teams so I took their season average)
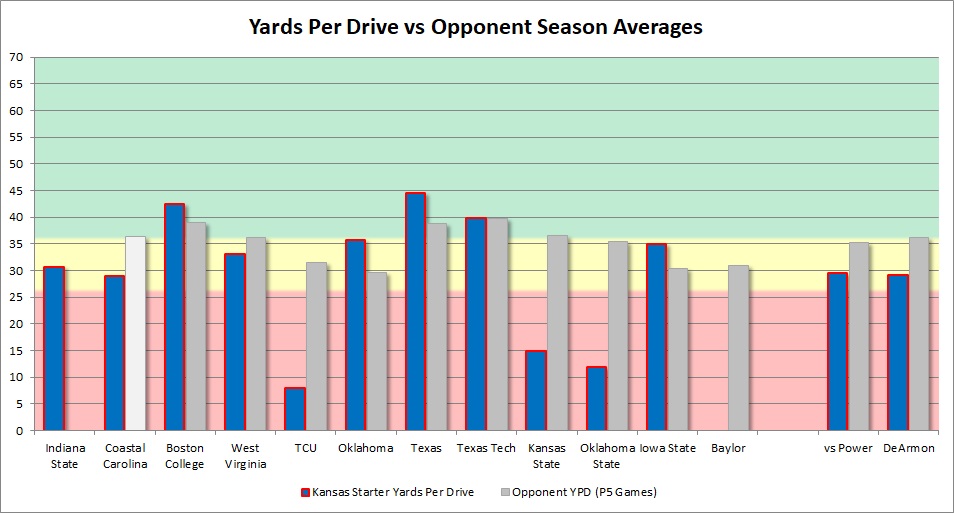
Their best games were Texas, Texas Tech, and Iowa State as the OU game had much of their damage coming late. KSU, OSU, and TCU were their worst power five outings and Coastal Carolina was bad given it was a recent FBS move-up and their offense didn’t come close to an average performance against them.
Offensive Overview Stats
The offense isn’t where they want to be but shows much more fight than the last couple of years. They average similar scoring drive percentage and third down percentages to most P5 teams against their schedule, protect the ball better, do better in the red zone, and are a little more explosive with a higher yards per play.
| Kansas vs Power 5 | Other P5 vs Same Teams | |
| Yards Per Drive | 29.55 | 35.25 |
| Points Per Red Zone Trip | 5.28 | 5.05 |
| Turnovers Per Game | 1 | 1.34 |
| Yards Per Play | 6.17 | 6.08 |
| Yards Per Game | 402.56 | 425.68 |
| % Of Drives Scored | 39% | 41% |
| 3rd Down % | 42.31% | 39.26% |
Offensive Passing Game
KU is a pretty solid passing attack that isn’t going to outperform expectations consistently but has made Boston College, Texas, Texas Tech, and ISU all have issues stopping them.
| Kansas vs Power 5 | Other P5 vs Same Teams | |
| Completion % | 60% | 62.13% |
| Yds/Att | 7.45 | 7.99 |
| Yds/Comp | 12.42 | 12.85 |
| Yards/Pass Play Including Sacks | 6.72 | 7.17 |
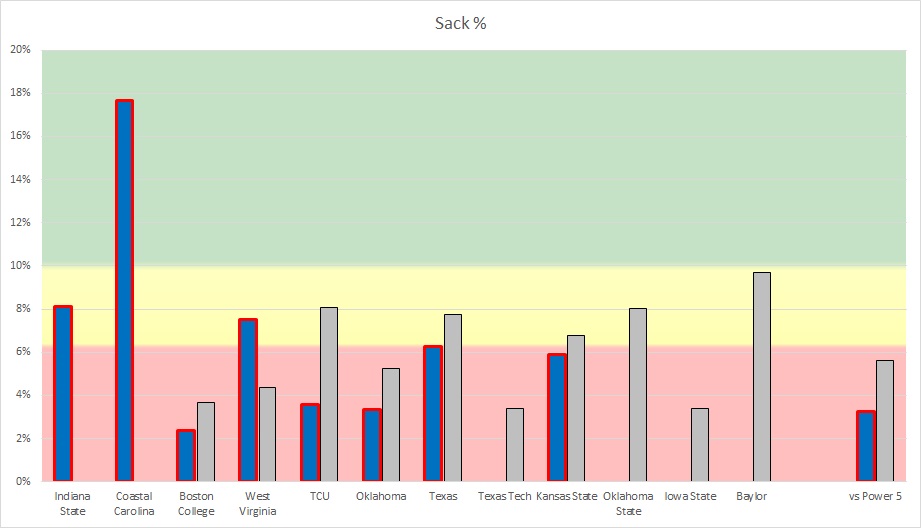
| Sack % | 5.2% | 5.74% |
| Int % | 2.45% | 2.49% |
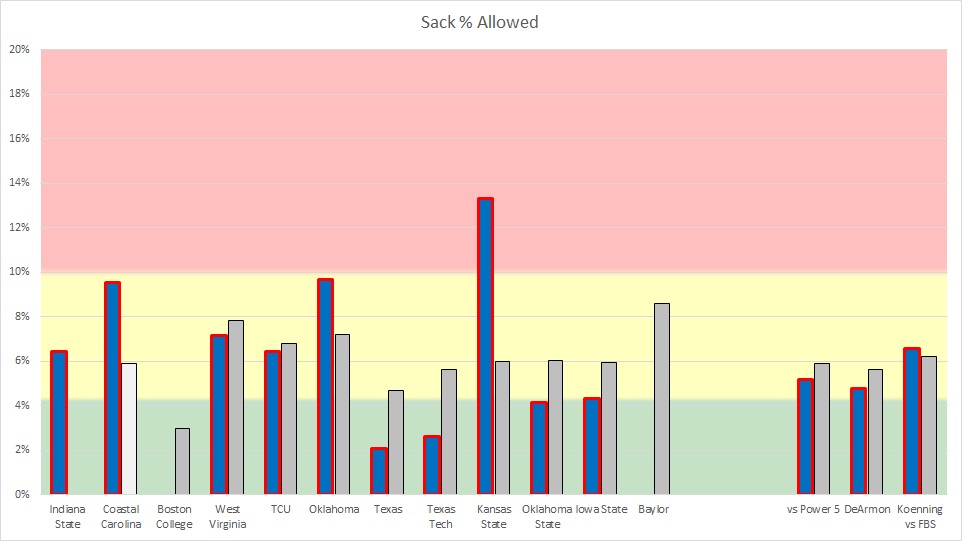
Since DeArmon took over they have been really solid in pass protection apart from the KSU game. This is a big departure from early in the year where everyone not named Boston College got to them at least decently. Baylor will be a tougher test than their prior schedule but the improvement is notable. (Note- Coastal Carolina’s comparison figure is some of their best opponents since they played no other P5 teams)
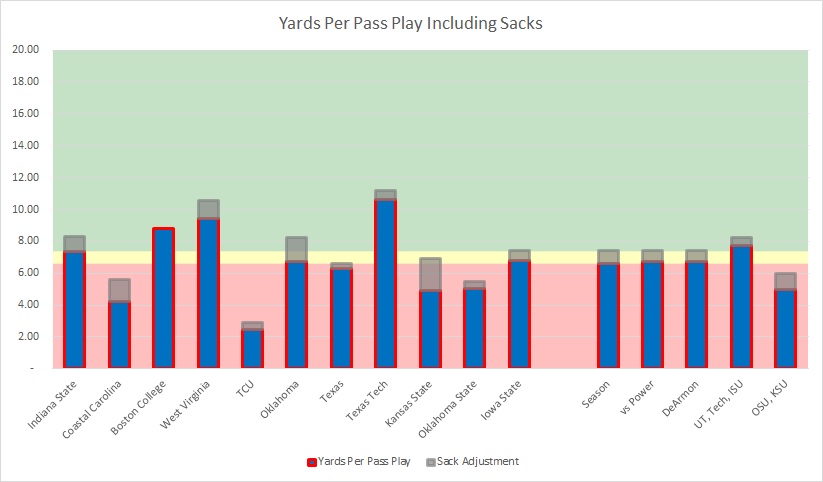
When you adjust their yards per attempt to include sacks (shaded portions of the chart are yards per attempt lost to sacks) their passing game hasn’t really been prolific outside of the BC, WVU, and Texas Tech games but it was solid against UT and ISU.
Offensive Run Game
On the ground KU is good in yards per carry but certainly is a pass first team only running it around 44% of the time.
| Kansas vs Power 5 | Other P5 vs Same Teams | |
| Yards/Rush | 4.74 | 4.33 |
| Yards/Non-Sack Carry | 5.48 | 4.96 |
| QB Non-Sack YPC | 3.9 | 5.83 |
| Non-QB YPC | 5.81 | 4.86 |
| Run Play % | 44.29% | 49.17% |
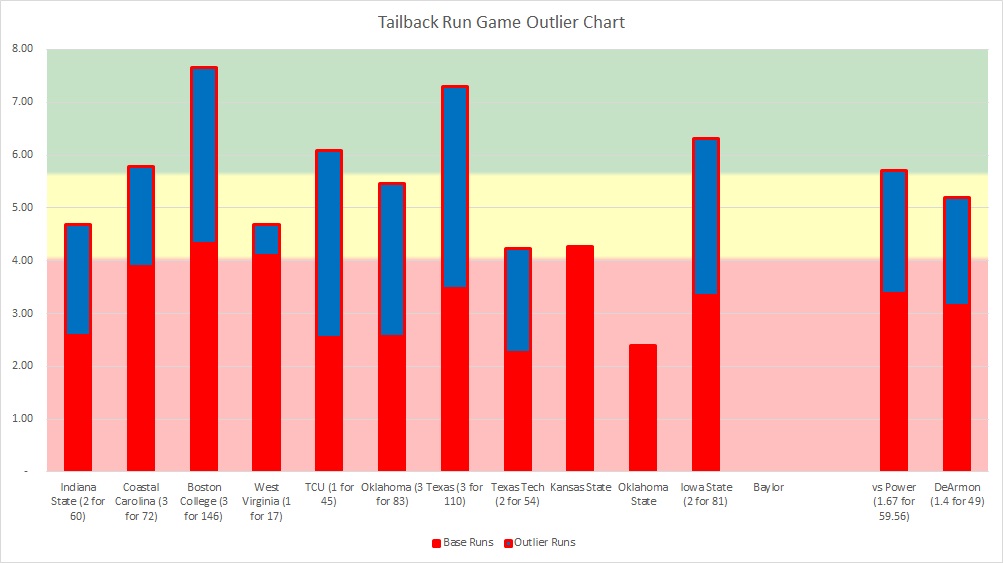
Tailback carries average a good yards per carry but the long runs by Pooka Williams spike that average considerably. Expect the stat sheet to be solid but for the down to down running to be sporadic. If they get loose they really get loose but outside of one or two carries a game their tailbacks average only 3.38 per carry.
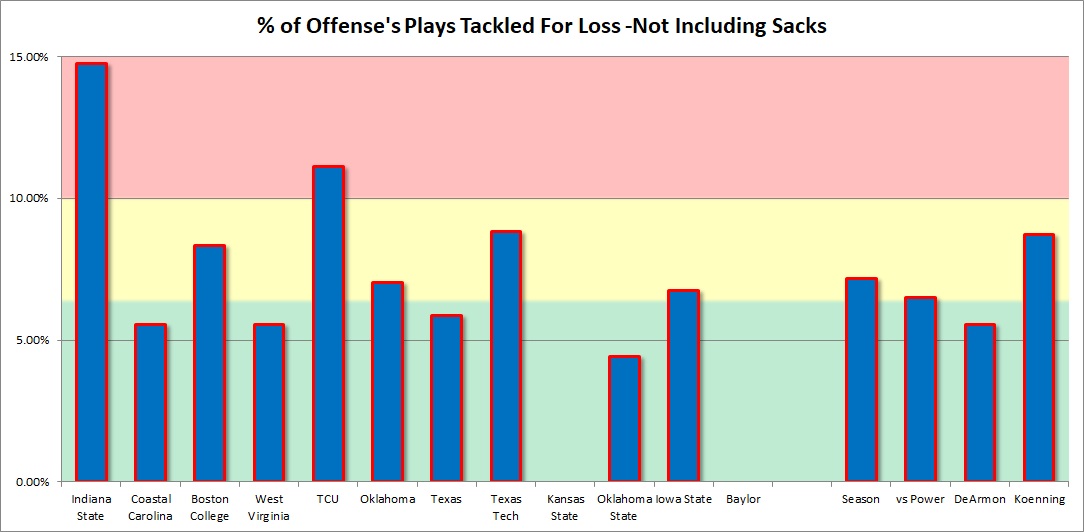
This offense has done a better job with avoiding negative plays on the ground since DeArmon took over. Outside of the Texas Tech game their opponents since then are getting non-sack tackles for loss at a much lower rate than opponents used to.
Defense
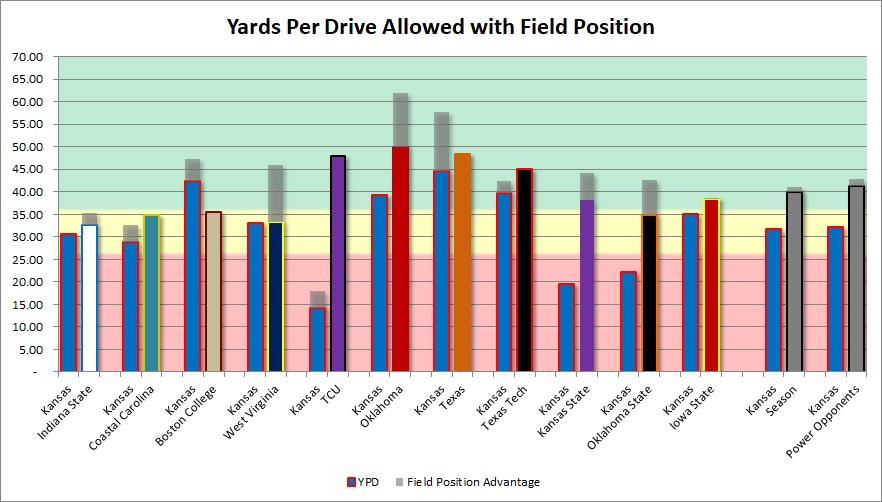
Defensively this group is struggling. They had a solid game against Oklahoma State and a limited West Virginia team but have mostly struggled against the better teams they faced. (Coastal Carolina Comparison Figure is a season average against other opponents, all others are other P5 opponents)
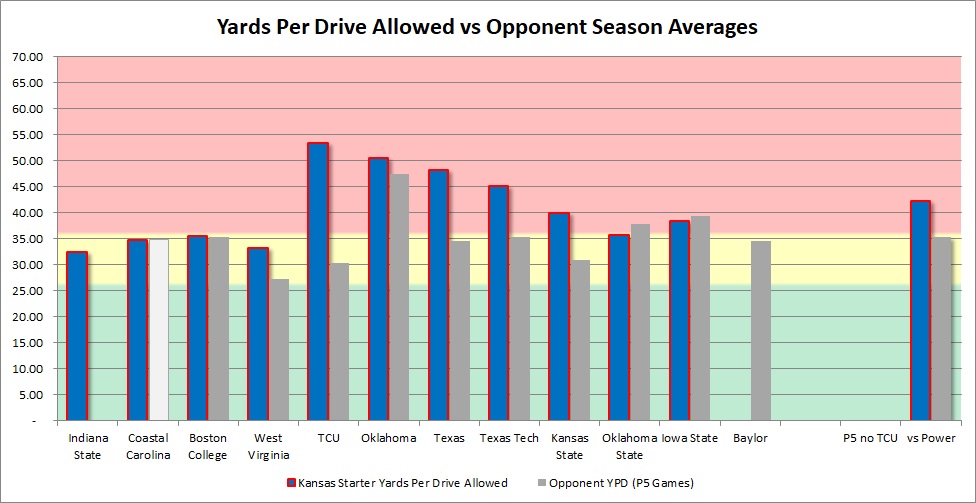
Their worst outings relative to expectations were against TCU and KSU where pedestrian offenses went off for big yards. This group has some players but the overall product struggles to stop teams.
Defensive Overview Stats
This defense struggles in each of the major metrics below. Half of the opponent drives score, they give up conversions on over half of their third down attempts, and they struggle to turn the ball over to their offense. Yardage is also not showing up well be each of the three metrics.
| Kansas vs Power 5 | Other P5 vs Same Teams | |
| Yards Per Drive | 42.26 | 35.38 |
| Points Per Red Zone Trip | 5.76 | 5.08 |
| Turnovers Per Game | 0.56 | 1.4 |
| Yards Per Play | 6.36 | 6 |
| Yards Per Game | 504.33 | 425.15 |
| % Of Drives Scored | 51% | 40% |
| 3rd Down % | 56.12% | 39.31% |
Defensive Passing Game
This pass defense gives up a lot of completions despite holding the yards per attempt to an expected number. This paired with low sack totals makes the yards per pass play high. They also struggle to get interceptions.
| Kansas vs Power 5 | Other P5 vs Same Teams | |
| Completion % | 64.86% | 61.6% |
| Yds/Att | 8.15 | 7.72 |
| Yds/Comp | 12.57 | 12.53 |
| Yards/Pass Play Including Sacks | 7.63 | 6.94 |
| Sack % | 3.27% | 5.71% |
| Int % | 0.98% | 2.69% |
Their issues getting to the QB have been pretty clear. Outside of one game against Coastal Carolina they struggle to get more than an average percentage in any one game. They did ok against WVU but against the rest of the Big 12 and BC they really aren’t getting to the QB.
This all has the effect of leading to a humbling performance per sack-adjusted attempt over the last seven games. Everyone threw it at a high rate on them during that span and I don’t see it being any different on Saturday.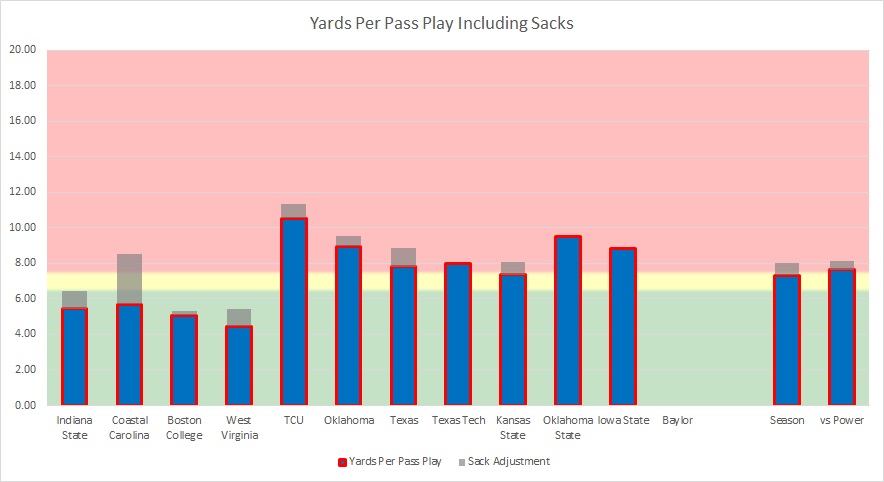
Defensive Run Game
Against the run they allow higher than expected yards per carry by each of the metrics I outline below. QB carries have hurt them and even before sacks are omitted they struggle to stop simple yards per carry.
| Kansas vs Power 5 | Other P5 vs Same Teams | |
| Yards/Rush | 5.09 | 4.54 |
| Yards/Non-Sack Carry | 5.4 | 5.11 |
| QB Non-Sack YPC | 6.66 | 6.04 |
| Non-QB YPC | 5.18 | 5.05 |
| Run Play % | 57.14% | 51.1% |
Outside of two games they haven’t had a decent percentage for non-sack tackles for loss. They aren’t getting teams off schedule and the two outliers here are likely due to playing Coastal Carolina and likely something schematic vs OSU.
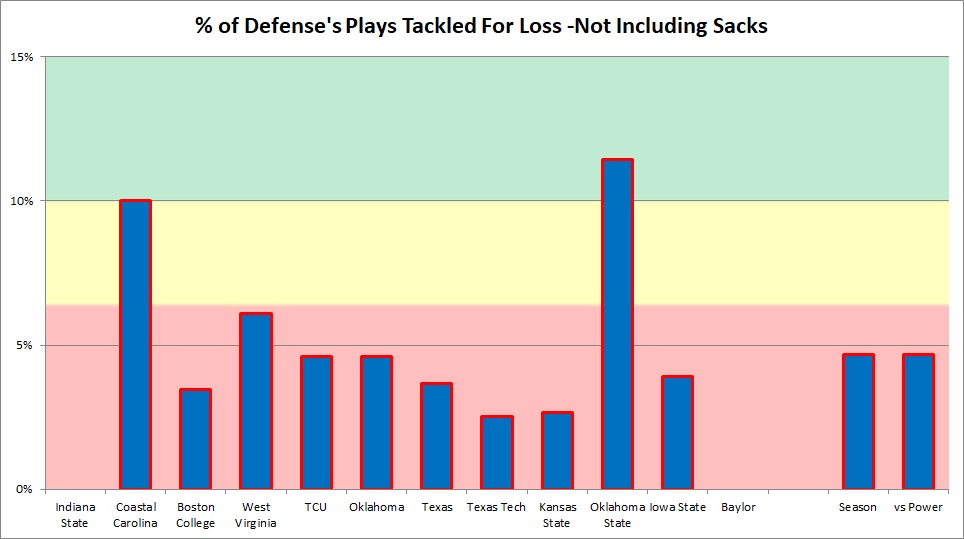
When we look at tailback carries they give up 1 or 2 long runs per game but even without those they give up almost 4.2 per carry to P5 teams. This is a group that you should be able to run against unless they overcommit schematically or otherwise guess right on your playcall.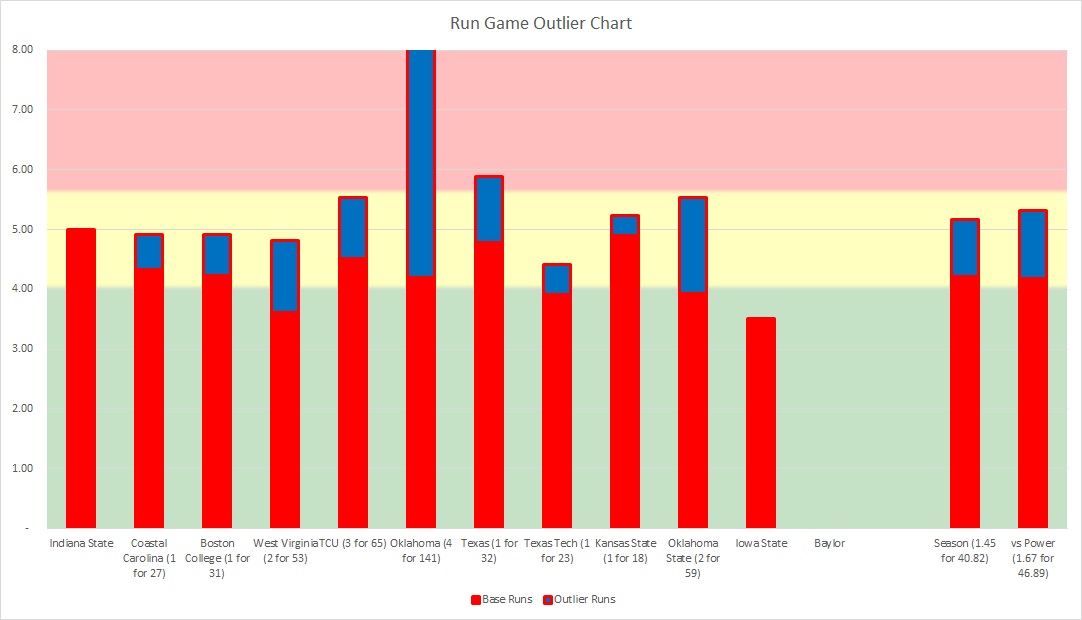
Return Game
This group is decent but doesn’t necessarily stand out in the return game. Their punt coverage however is showing up poorly after TCU and OU returned 5 for 185 on them but their other P5 games average allowing a similar number to what others do against them. They are typically losing the field position battle by a yard and a half on average but it’s not consistent at all as they held a 13+ yard advantage on Texas but had OU and WVU hold 12+ yard advantages on them.
| Kansas vs Power 5 | Other P5 vs Same Teams | |
| Kick Return Average | 21.09 | 20.7 |
| Punt Return Average | 7 | 5.88 |
| Opponent Kick Return Average | 21.09 | 20.87 |
| Opponent Punt Return Average | 17.64 | 6.97 |
| Average Field Position | 71.37 | 71.72 |
| Opponent Average Field Position | 69.75 | 71.31 |
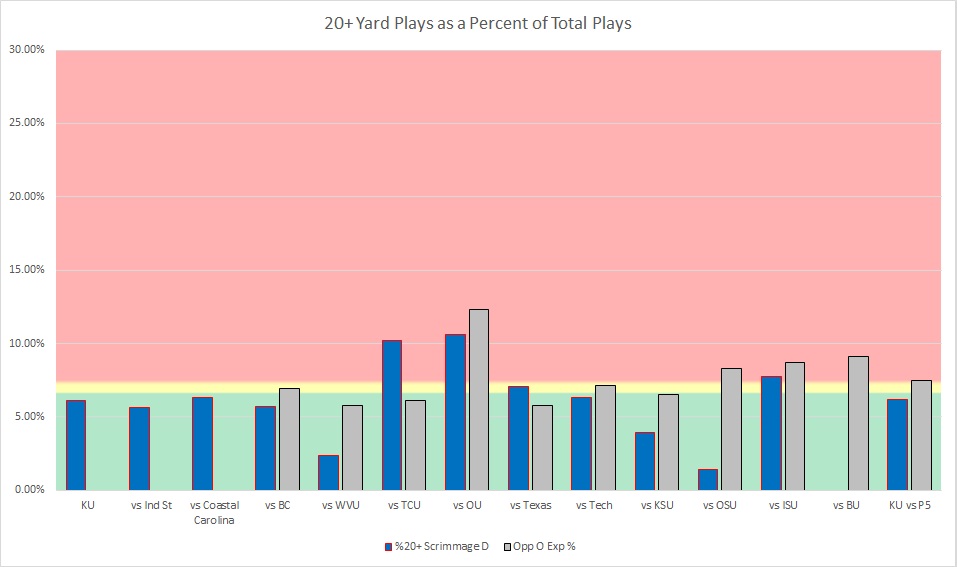
Explosive Plays
20+ yard plays can turn a game and KU’s struggles above have been somewhat mitigated in certain games as they won the explosive percentage comparison in nine of eleven games. They lost it badly against TCU and lost it against Coastal Carolina which made these their most humbling losses of the year.
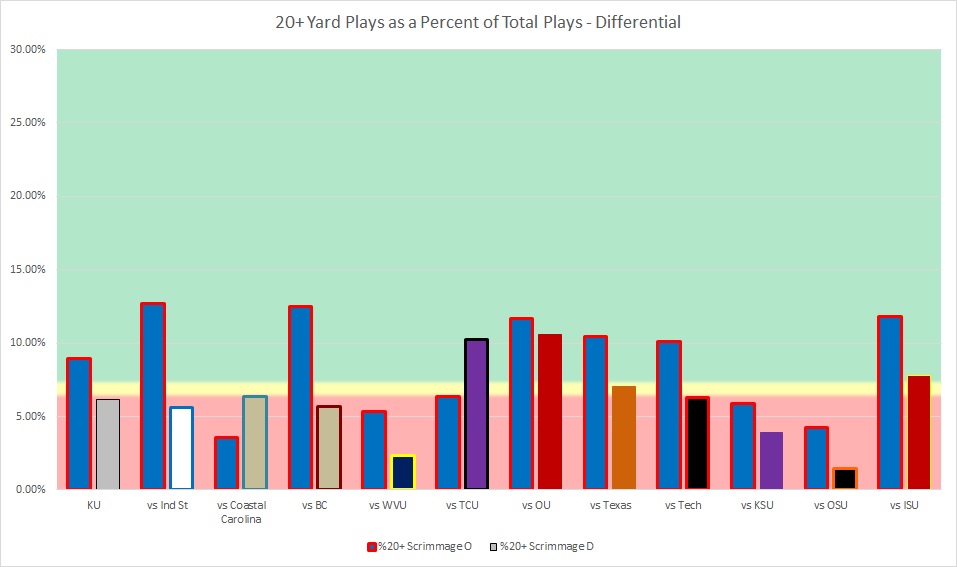
Offensively their best outings tend to be when they hit their big plays. They hit more than most teams tend to give up on average but when the big play is denied them their losses soon follow. This group has several home run hitters and keeping them quiet is priority #1 for the Baylor defense.
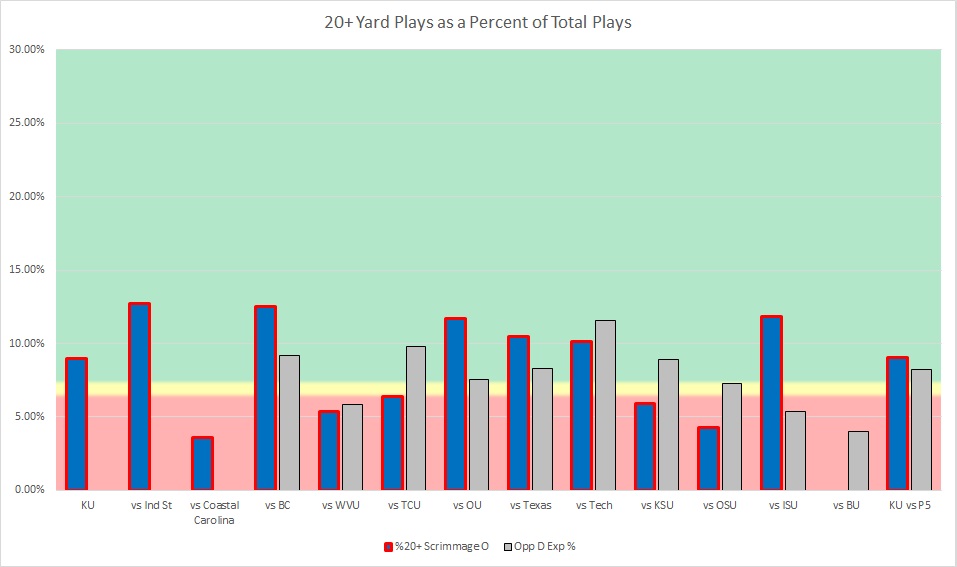
For the most part they have limited big plays as a percentage but I do think some mop up snaps are inflating the denominator for these percentages. However KU has done a good job against OSU, WVU, and KSU keeping them mostly bottled up.
Conclusion
Kansas looks statistically like a team that isn’t expected to have a good record but their ability to hit big plays and a potentially banged up and not focused opponent on their Senior day could make this a game. KU will be fired up after almost knocking off Iowa State. If Baylor’s trend of limiting big plays continues I love their chances but Pooka Williams, Stephon Robinson, and the rest of them will try to steal a game much like 2017 Baylor almost stole a few with Mims, Ebner, Hasty, Platt, and others.
Follow @ Baylor_S11 on Twitter!