This is part two of my preview covering statistics. Other parts cover X’s and O’s and their roster.
The BYU Cougars are a very good team that averages a margin of victory is 27-20 this season with a 5-1 record. In games this season BYU has have faced several solid teams from the Pac-12 and Mountain West and are well tested. This group won’t be an easy out and Baylor needs to be ready.
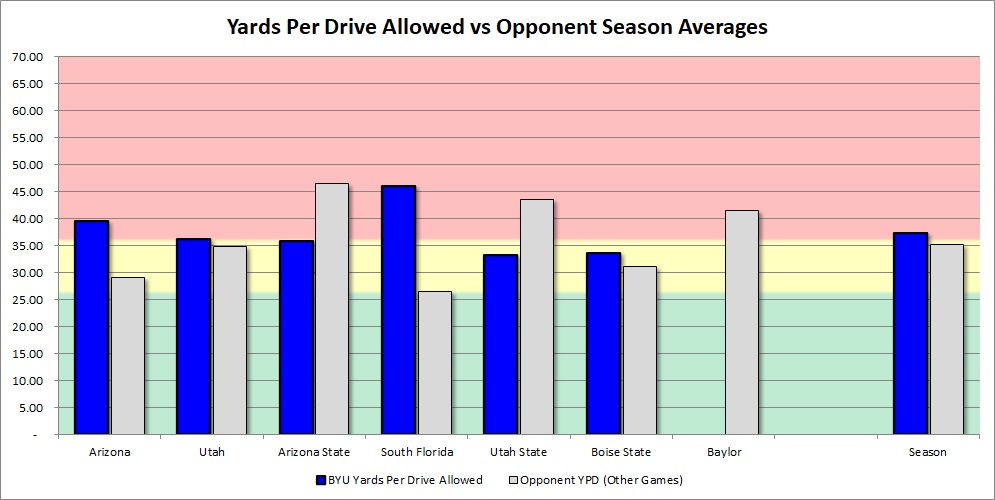
Below you see BYU’s yards per drive (yellow and blue bars) and opponent’s yards per drive (other colored bars) in the games. The background is red, yellow, or green to signify if that yardage per drive is bad, average, or good for an offense. The transparent bars are used to signify the average per-drive advantage one team has in starting field position. So if a team averages starting 10 yards closer it shows up as an added ten yards per drive.
Usually the Cougars win the field position battle and almost always generate solid yards per drive. Turnover issues in the Boise State game likely played a role in Boise’s massive field position advantage that served as an equalizer in the game.
Offense
Below you can see BYU’s yards per drive in the yellow and blue bars while what other teams averaged against the opponents on the schedule is in gray with the background signifying what is poor, average, or good for an offense.
Needless to say, the BYU offense has been great at moving down the field. The offense has outperformed expected values in each game for yards per drive.
Offensive Overview Stats
BYU outperforms expectations in each of the overview metrics I list below with the exception of yards per game which is likely due more to pace of play than any significant issue offensively. BYU is also really solid at red zone points per trip.
| BYU 2021 | Other Teams vs Opponents | |
| Yards Per Drive | 41.33 | 35.2 |
| Points Per Red Zone Trip | 5.52 | 4.64 |
| Turnovers Per Game | 1.17 | 1.4 |
| Yards Per Play | 6.35 | 5.98 |
| Yards Per Game | 406.17 | 416.93 |
| % Of Drives Scored | 45% | 40% |
| 3rd Down % | 44.29% | 41.04% |
BYU hits a decent amount of big plays which yards per play average indicate but what’s really tough with this team is that the “reliable, violent, offense” is very reliable at converting third down situations on either third or fourth down.
Below we see its offense’s conversions on third or fourth down compared to what opponents average in other FBS games. In other words, if a team gets to third down, will it convert on either third or fourth down? In BYU’s case, the Cougars not only do so at a very high rate but well in excess of what opponents typically allow.
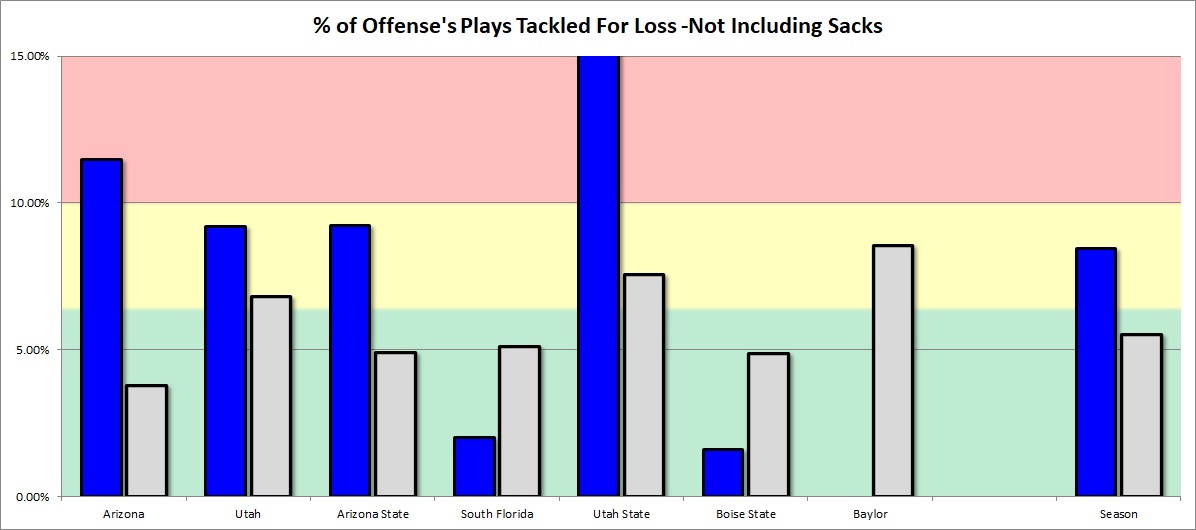
This is made a little more puzzling by how many tackles for loss the unit allow. USF and Boise didn’t generate many while the other four clearly did. Much of this is tactics but when the four that did limited BYU to 36 yards per drive and the other two allowed 50, it’s no secret the plan is to get the group off schedule.
The chart below shows the Cougar opponent non-sack tackles for loss as a percentage of plays in the blue bars with the red, yellow, and green backdrop giving context for poor, average, and good benchmarks.
Offensive Passing Game
In the air this group is efficient. The QB will complete a lot of passes, rarely throw picks, have better than expected yardage per attempt, and rarely give up sacks.
| BYU 2021 | Other Teams vs Opponents | |
| Completion % | 65.17% | 58.7% |
| Yds/Att | 8.01 | 7.46 |
| Yds/Comp | 12.28 | 12.72 |
| Yards/Pass Play Including Sacks | 7.52 | 6.45 |
| Sack % | 2.73% | 7.74% |
| Int % | 1.64% | 3.1% |
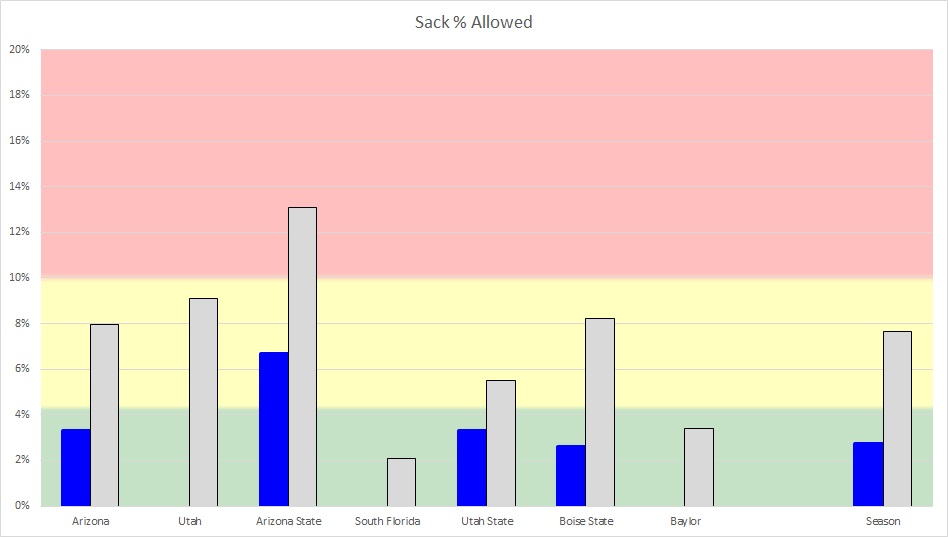
How good has the protection been? Below we see the sack percentage allowed compared to what opponents otherwise average. BYU has been really good at keeping the QB clean.
Offensive Run Game
Honestly, this run game isn’t as statistically dominant as I was expecting. Part of that has to be teams keying on it. Despite this, it is still very consistent.
| BYU 2021 | Other Teams vs Opponents | |
| Yards/Rush | 4.91 | 4.93 |
| Yards/Non-Sack Carry | 5.28 | 5.59 |
| QB Non-Sack YPC | 8.71 | 7.17 |
| Non-QB YPC | 5.03 | 5.39 |
| Run Play % | 52.34% | 55.19% |
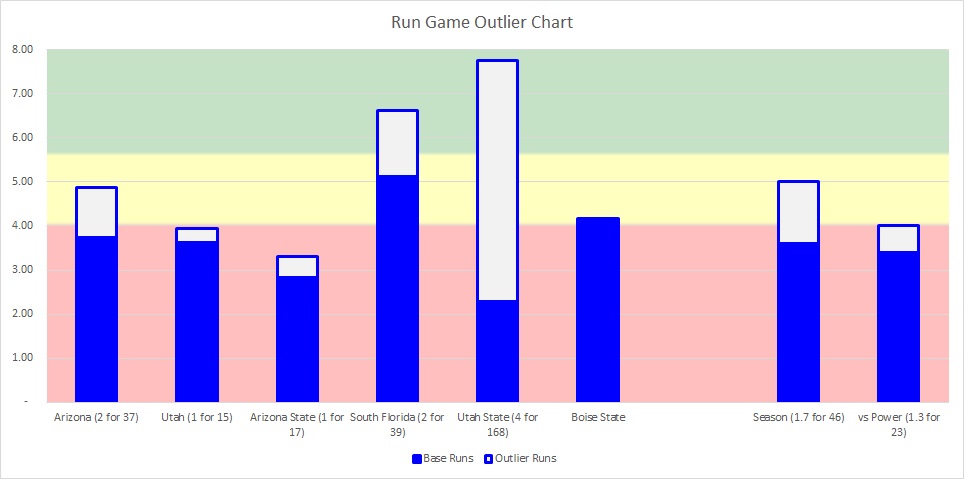
Even when you omit outlier runs of 16-20+ yards, BYU has been consistently decent despite running into defenses trying to take it away.
Below the combined stacked bars vertically equal BYU’s yardage per carry. The white bars are what a small amount of “outlier runs” of around 16-20 yards or more contribute to its tailback yards per carry average. The blue bars are what the remaining majority of their carries equate to. The background gives a barometer in what is good for an offense with red (bad), yellow (average), or green (good) colors giving context.
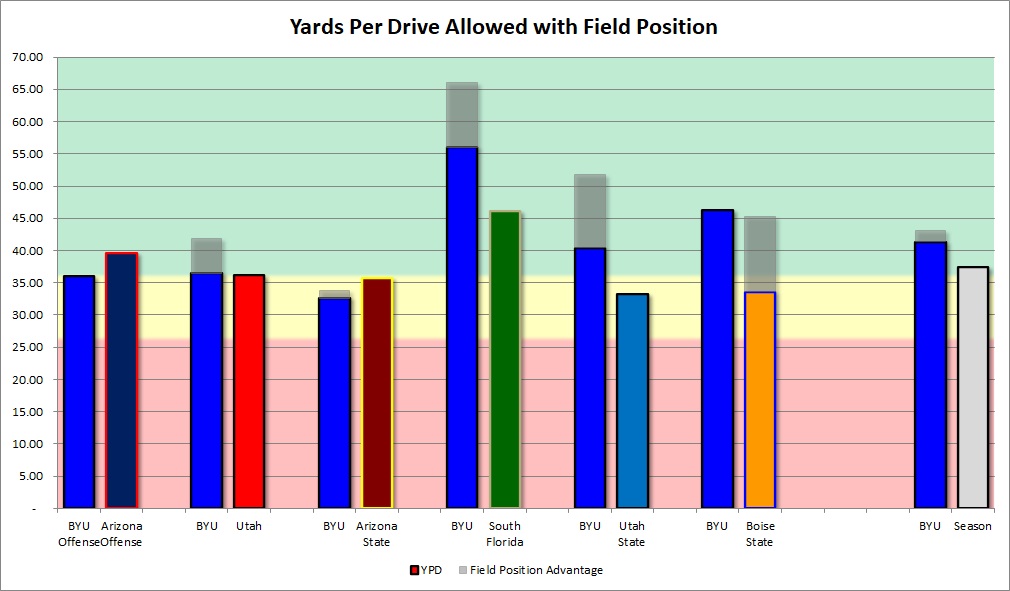
Defense
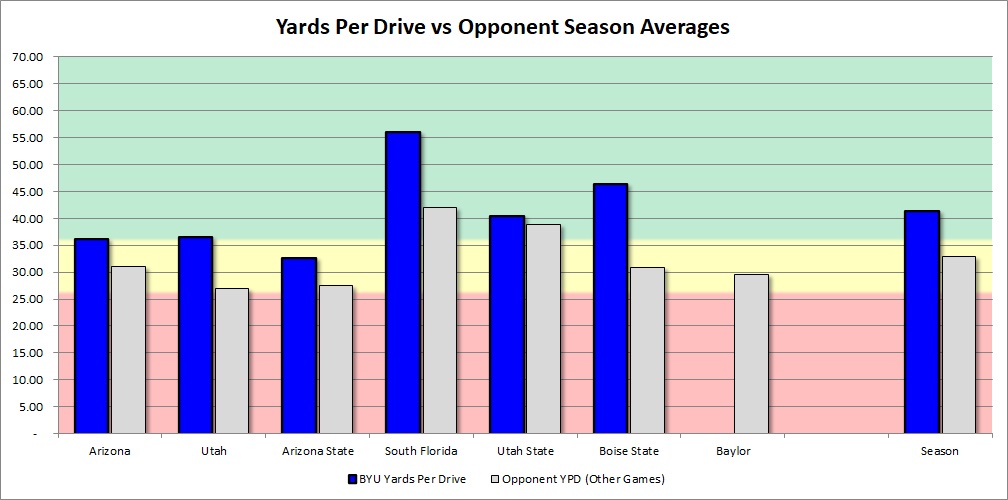
Below we see a similar chart to what was explained with the offense only now the context is reformatted with the colors reflecting good, average, or bad for the defense.
What it shows is that this defense has had a couple solid outings but has mostly struggled in yards per drive relative to expected values. The USF game was by far the worst outing as a pedestrian offense was able to simply stay on the field continually after its first two drives.
Defensive Overview Stats
In the overview statistics we see BYU is solid in red zone defense, turnovers, and yards per play. However, yards per drive, scoring percentage, and third downs are all below average for its schedule. This speaks to a bend but don’t break strategy that is oftentimes employed.
| BYU 2021 | Other Teams vs Opponents | |
| Yards Per Drive | 37.42 | 35.49 |
| Points Per Red Zone Trip | 4.2 | 4.32 |
| Turnovers Per Game | 1.67 | 1.67 |
| Yards Per Play | 5.21 | 5.55 |
| Yards Per Game | 368.17 | 394.16 |
| % Of Drives Scored | 41% | 35% |
| 3rd Down % | 41.76% | 39.77% |
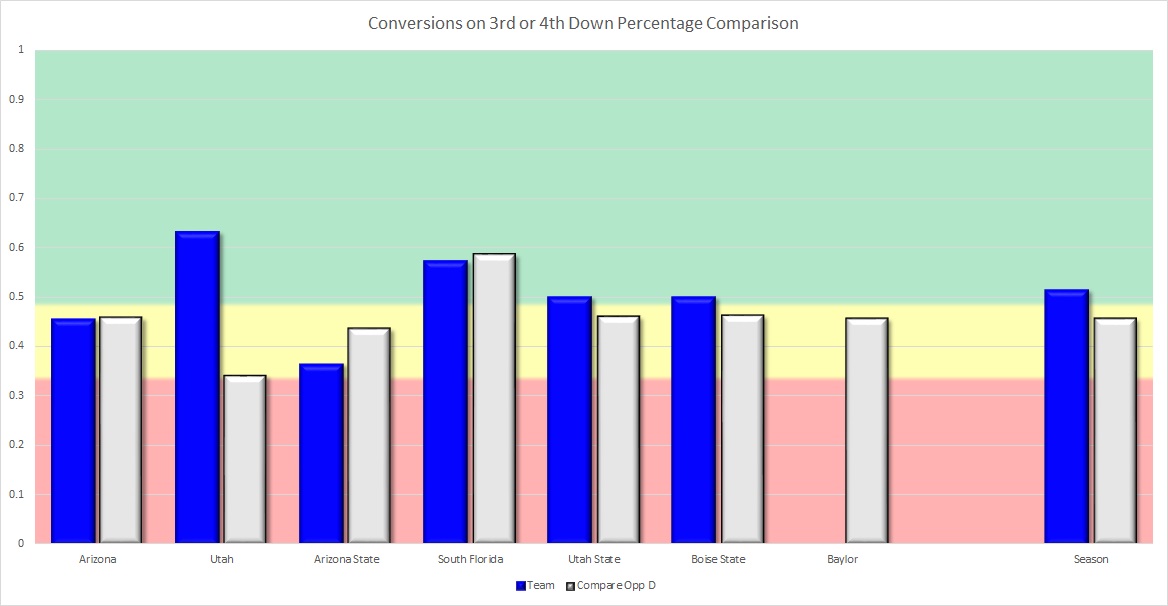
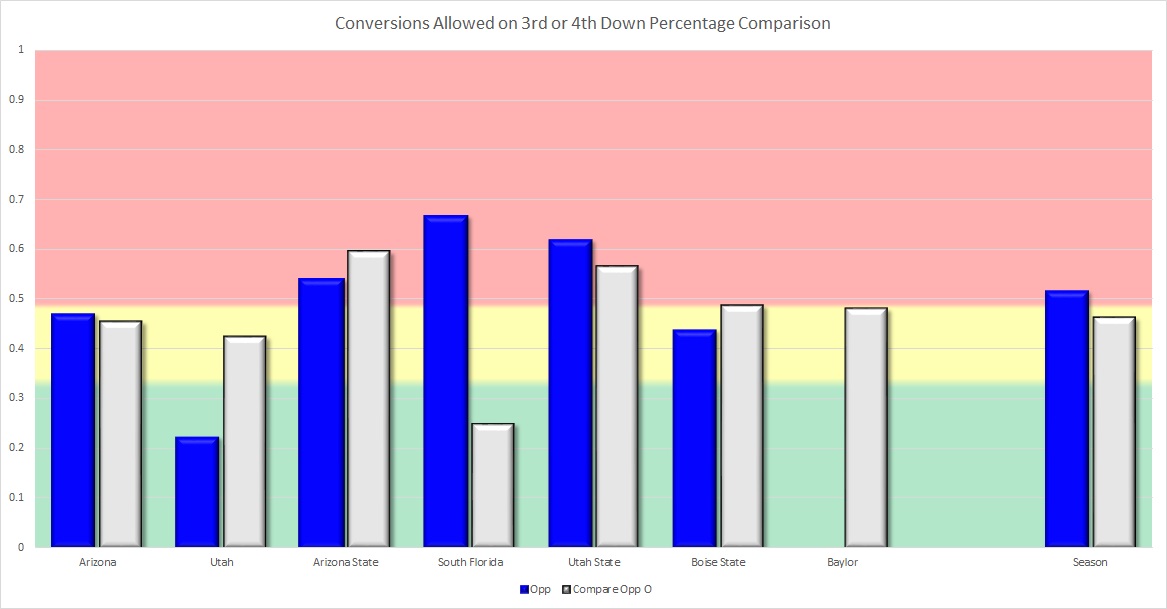
Other than against Utah, BYU hasn’t really done well getting off the field in third or fourth down scenarios.
Below we see its defense’s conversions allowed on third or fourth down compared to what opponents average in other FBS games. In other words, if a team gets to third down, will it convert on either third or fourth down? Against BYU, the answer has mostly been yes and it was very obvious against the otherwise struggling USF Bulls.
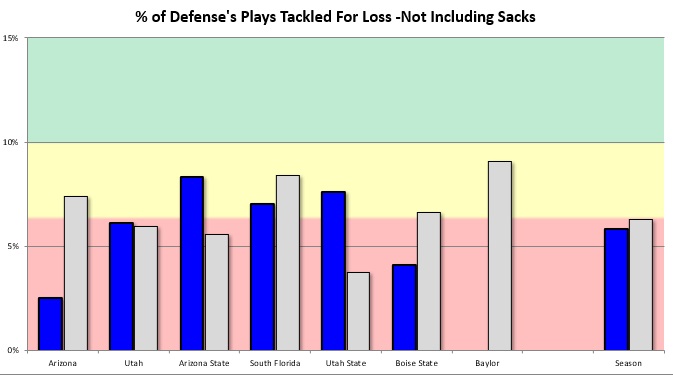
BYU has had a couple games where it was pretty disruptive with tackles for loss but overall aren't going to be the most disruptive team Baylor plays in this regard. The chart below shows the Cougar non-sack tackles for loss as a percentage of plays in the blue bars with the red, yellow, and green backdrop giving context for poor, average, and good benchmarks.
Defensive Passing Game
BYU allows a lot of short completions with a low yardage per reception. Its results are pretty typical on sack percentage overall and in interception percentage.
| BYU 2021 | Other Teams vs Opponents | |
| Completion % | 65.2% | 60.59% |
| Yds/Att | 7 | 7.26 |
| Yds/Comp | 10.74 | 11.98 |
| Yards/Pass Play Including Sacks | 6.12 | 6.57 |
| Sack % | 5.99% | 5.32% |
| Int % | 2.76% | 2.84% |
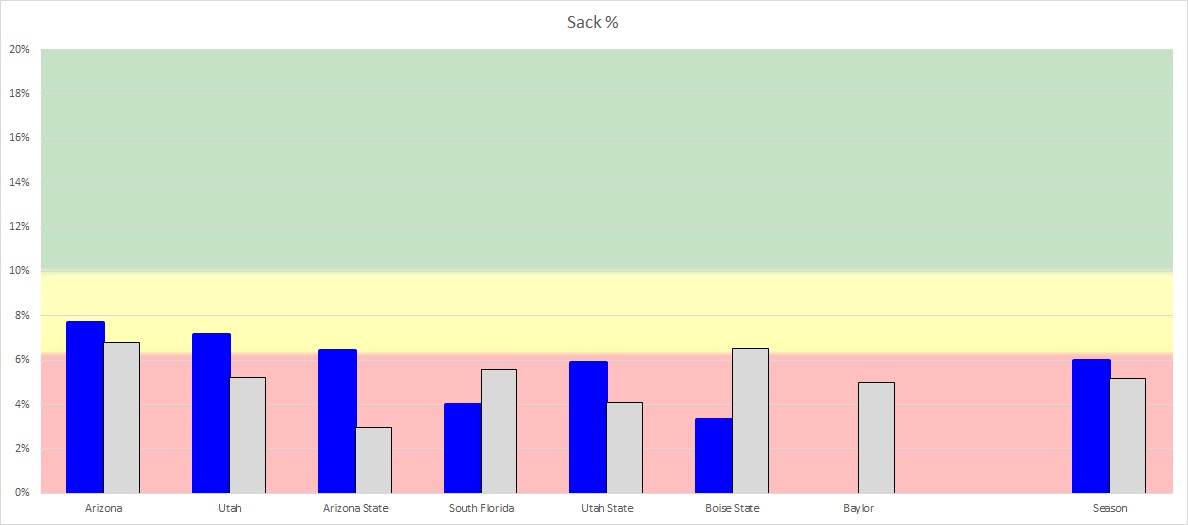
This chart is the same as the prior chart except now it’s sack percentage instead. We see that BYU did better than expected against AZ, Utah, ASU and USU, but underperformed against USF and Boise. BYU isn’t setting the world on fire with this but it will get some pressure.
Defensive Run Game
Against the run BYU does a solid job in all these stats.
| BYU 2021 | Other Teams vs Opponents | |
| Yards/Rush | 3.55 | 4.01 |
| Yards/Non-Sack Carry | 4.26 | 4.53 |
| QB Non-Sack YPC | 4.99 | 6.52 |
| Non-QB YPC | 4.22 | 4.43 |
| Run Play % | 48.82% | 49.93% |
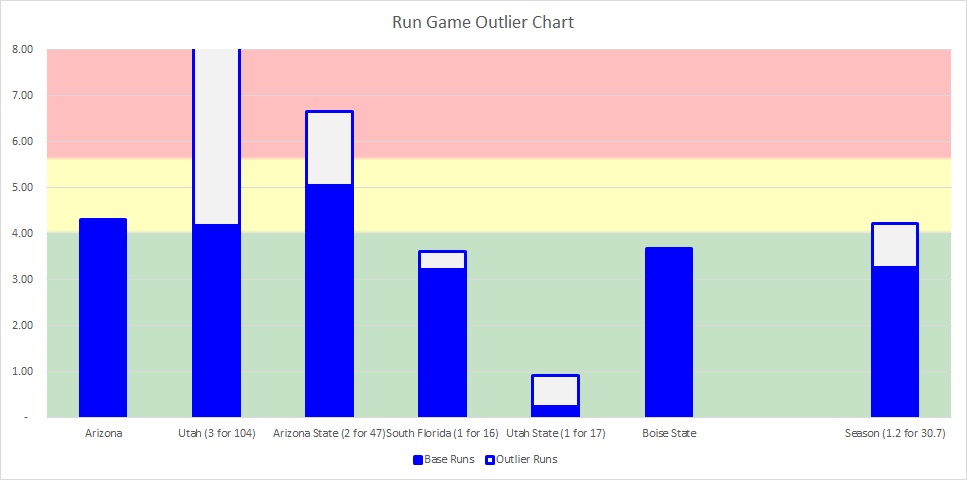
BYU absolutely stomped USU’s run game but all other opponents have been able to get at least a little consistent production against them. Utah and ASU also hit a couple long ones as well. This chart is the same as we saw on offense just with the colors flipped to give benchmark context for the defense.
Return Game
BYU is decent but not dominant in the return game and coverage units are ok. BYU typically holds a 2-yard field position advantage.
| BYU 2021 | Other Teams vs Opponents | |
| Kick Return Average | 18.83 | 22.6 |
| Punt Return Average | 8.6 | 5.51 |
| Opponent Kick Return Average | 22.38 | 17.8 |
| Opponent Punt Return Average | 10 | 16.86 |
| Average Field Position | 72.47 | 70.68 |
| Opponent Average Field Position | 74.17 | 72.45 |
Conclusion
This team has one of the best offenses Baylor will see. It’s well designed, the players fit the scheme, and it's really tough to get off the field. The defense isn’t overly disruptive and can be prone to giving up smaller gains. It will be key to stay on schedule and convert third downs & red zone scenarios.
Aside from the abberration against Boise, this team generally protects the ball and does a good job taking it away. Baylor can’t give BYU that kind of help on Saturday.
Expect an opponent that would fit right in with some of the tougher Big 12 games this year.
Follow @Baylor_S11 on Twitter!