During the years when major conference realignment happens everyone runs to TV rating data to try and make sense of who carries what value and how it impacts realignment. Television ratings are just one data point and can be heavily influenced by the network you appear on the time of day or the day you happen to play. Ratings are not perfect but can be a reflection of drawing power in the right context. I have already spent two articles addressing both the flawed methodology of one national writer’s analysis and highlighting the impact of television windows on viewership numbers.
However much of the analysis doesn’t account for variables like what network you appear on or account for different sample sizes. This article attempts to provide a quick look at the TV windows for the top seven leagues by network and then will look at how the leagues stack up in proportional numbers of games per school. To keep it even we are adding the following criteria:
- Conference Games Only: It’s your group alone compared to the other group alone. No Notre Dame coming to boost the AAC with their annual Navy game or similar scenarios.
- P5 Championship Games Are Omitted: These can go as high as 17mm and all but four cleared 3.6mm. This is well ahead of any normal network TV window. I left the G5 ones as they almost always are up against the bigger P5 title games and face similar time slot competition to what we see on Black Friday, some Labor Day week spots, and some of the lighter competition windows throughout normal weeks. Also, some of the G5 leagues have very few nationally rated games and we need data to compare.
- Data Since 2014: This is the first year that all the moves occurred in the top seven leagues other than UConn leaving the AAC and Navy joining in 2015. It’s when Louisville finished joining the ACC, Maryland and Rutgers joined the Big Ten, and when the AAC had 11 of the 12 that would make up their roster during most of the last decade.
-
Looking At A “Typical” Week: For Comparisons of TV Windows we are omitting Labor Day week, Thanksgiving Week, Week Zero, Championship Week, or any other atypical week: This is to evaluate how they perform on a “typical” week’s time slots where you have the most comparable data.
- For Comparisons of TV Windows 2020 is Omitted: Due to competing game variances and different quality of games during 2020 thanks to cancellations and half the country not playing for much of the season, it’s thrown out too. This is for comparisons of how leagues perform on “typical” Saturday, Friday, or Thursday slots. 2020 was anything but typical.
Leagues By Day, Time, and Network
With those details out of the way let’s look at the individual windows. As I mentioned before in prior articles, it’s clear that the network matters a ton. Even top-tier games like Texas-Oklahoma, Oregon-USC, and others can perform differently on ESPN or FS1 than they do on ABC or FOX. The time of day and the day itself also matter as they typically control how many competing games are on and what quality of competing games are dividing viewership. Below are some median values from a prior analysis to paint the picture clearer.
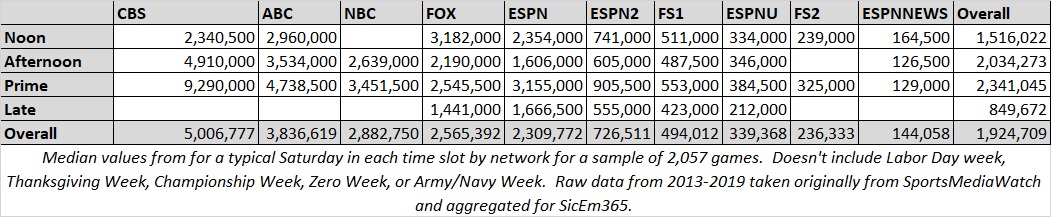
As you can see CBS and ABC do MUCH better in viewership than ESPN2, FS1, or ESPNU dream of doing. So controlling for the network and time slot is a good first step. Below are how the top seven conferences stack up on Saturday. (A couple of single-game samples were omitted as it’s just one game)
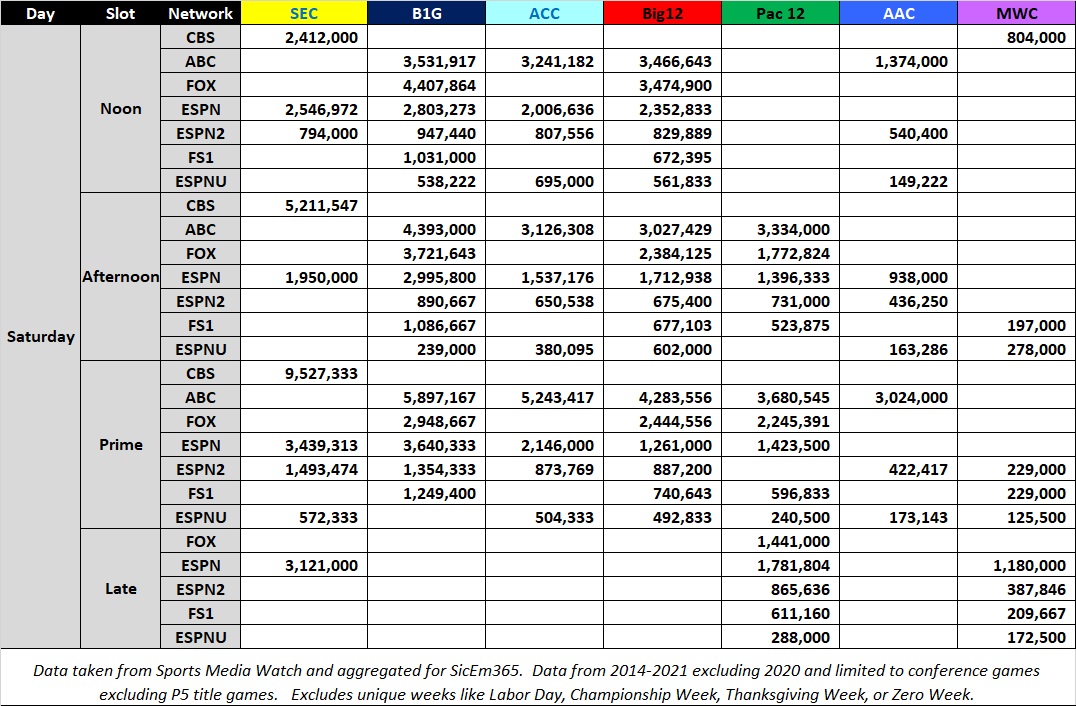
As you can see the SEC on CBS absolutely kills it in the afternoon and whenever they get a prime-time spot there. ABC typically cleans up in prime time as CBS and NBC usually don’t have games there and ABC had at least partial rights to every P5 school outside the SEC. The Big Ten tends to do very well on FOX’s noon slot, where FOX puts several of their best games.
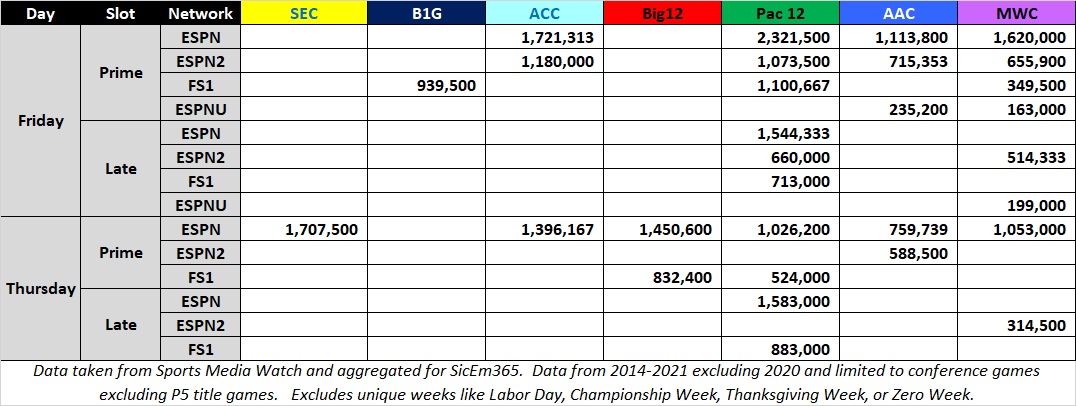
Below is how viewership stacks up on a typical Thursday or Friday. The SEC, ACC, Big 12, and Big Ten tend to show up less while the Pac 12, AAC, and MWC show a little more flexibility working with their TV partners. After realignment I expect the Big 12 to play more weeknight games to try for more revenue from television partners.
How did realignment impact the Big 12 or Pac 12 in this analysis? Losing Texas, Oklahoma, USC, and UCLA obviously weakens the television impact for those two leagues. Additionally, when you have the ACC commissioner being asked at media days about how strong the ACC grant of rights agreement is to potentially stop teams from leaving we can safely assume that there’s at least talk of schools like FSU, Clemson, or others potentially looking around for more money elsewhere. With that background, I also included how much omitting FSU or Clemson impacts the ACC. Below is the same analysis done on just conference games but excluding Texas, Oklahoma, USC, UCLA, Florida State, and Clemson. These are also compared to the pre-realignment 11 AAC teams and 12 team MWC for context.
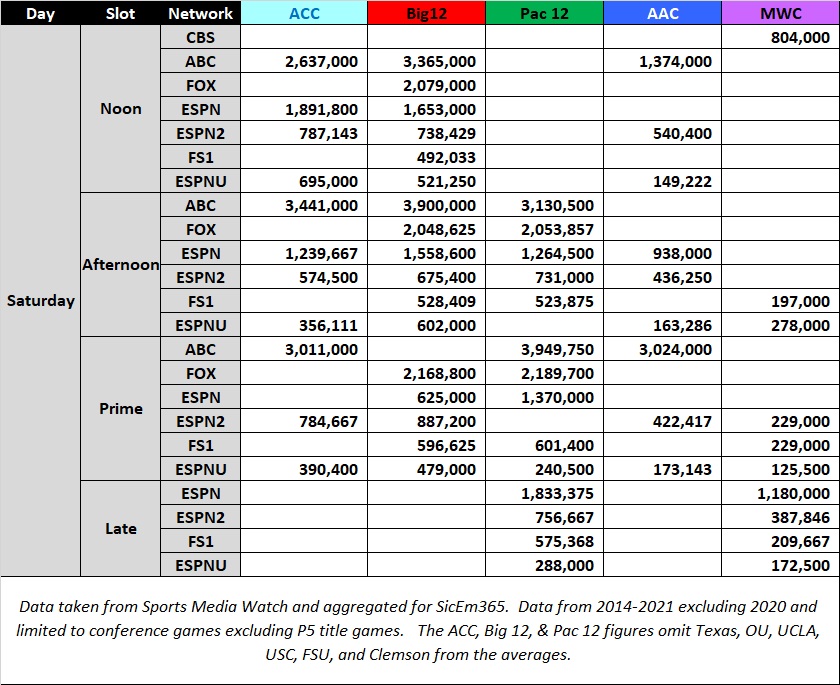
What we see is that the remaining members of the P5 conferences perform substantially better than the intact AAC and MWC. Relative to each other there are some similarities. The Big 12 performs fairly well relative to the others listed on this chart. They perform better than competitors on the noon and afternoon ABC slot, the afternoon ESPN slot, and similar in the vast majority of the windows that they are not in first. We also have a breakdown below of how things look on Thursday and Friday.
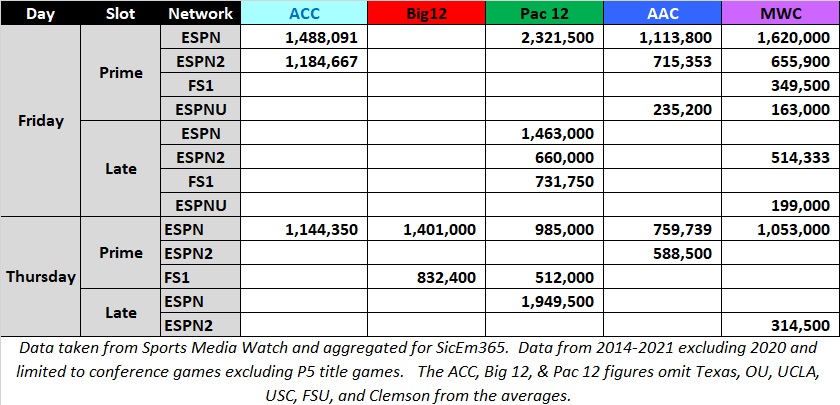
We see a similar breakdown again for the most part with the P5 still performing better except for a couple one game samples for the MWC on ESPN where Boise State showed up well.
How Do They Rank In Proportional Average?
I usually want to account for network and window differences but since the leagues, in general, tend to have similar amounts of network splits per school, I have included an analysis of per school averages of the conferences. With the possible exception of the leagues that lost schools in realignment, the network appearances are close enough to make it comparable. So with the caveat that the Big 12, Pac 12, and AAC are disadvantaged in a post-raid section of this analysis, we’ve got at least a starting point for some simple & quick comparison. Long-term, I plan to add more advanced methods but this will be a good interim step.
Why Do We Need A Proportional Average?
The above analysis is good as a general idea of how conferences do relative to network, and this would be the starting point for a smarter analysis. In the interest of giving a quick idea for ranking the leagues, it’s easy to use averages. However, it’s important to use equal numbers of games per school as everyone’s lower end of the schedule will draw significantly less than the games at the top, as you can see here when I chart out the P5 and Notre Dame games in my sample. Even the outstanding Alabama and Ohio State lines racing over everyone see this happen.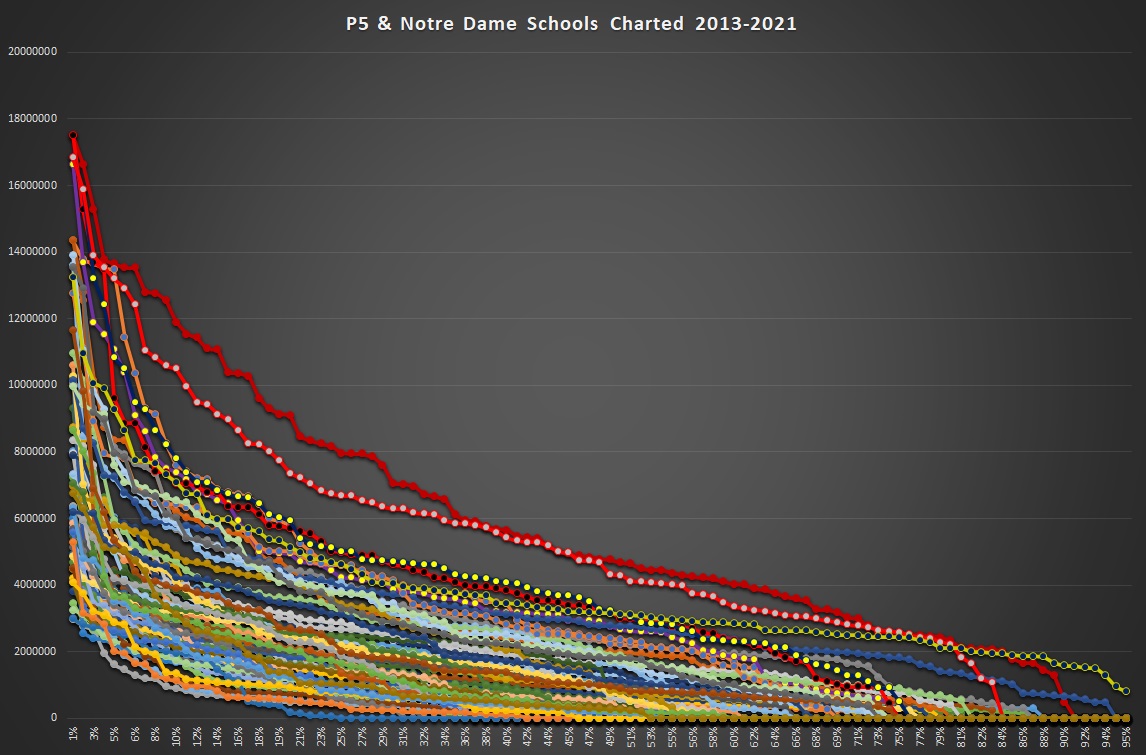
Comparing the different amounts of each school or league’s inventory will lead to questionable results. An absurd example is 2018 Vanderbilt and Miami.
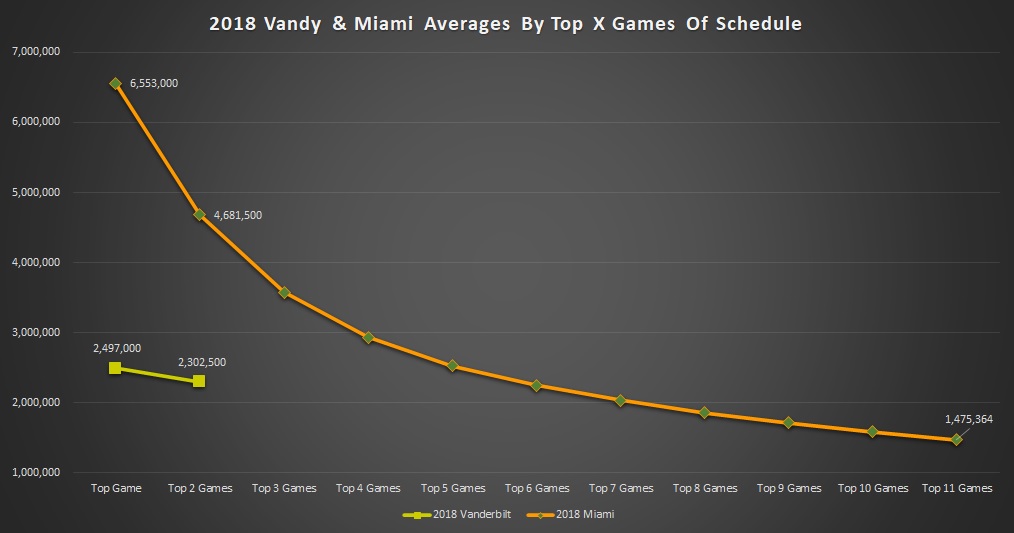
Vandy’s two-game sample averaged 2.3mm viewers against Notre Dame and Florida. Miami however averaged 1.475mm in 11 games. Why so different? Vandy only had two games reach nationally rated networks so the average of available data is comparing the top 17% of Vandy’s season to 92% of Miami’s season, which includes games against Duke, Toledo, and FIU. Needless to say, a simple average gives an absurdly wrong view. The correct answer for how they compared was to compare Miami’s top 2 game average of 4.68mm to Vandy’s top two. Vanderbilt’s other ten games were on the SEC Network which is not nationally rated. Does anyone think they passed 1 million for any game other than maybe UGA? Much less 2.3mm? If a game isn’t nationally rated there won’t usually be publicly available data for it. As such, a simple average omits weaker games for schools or leagues who either didn’t broadcast those games or broadcast them on a network that isn’t rated enough to give the public data.
Taking this logic to conferences means we take the number of teams in a conference and using that — alongside the number of years sampled — we can average the right number of top games to compare across conferences. The same number of games per school per year is the goal.
How Do The Proportional Averages Look For The Conferences?
Below you see each of the conferences as a rolling average line for the top X number of games per school for the 2014-2021 seasons. This is including Texas and Oklahoma in the Big 12 line and includes USC and UCLA in the Pac 12 line. It also reflects schools in each conference prior to recent realignment.
Note: ALL regular season weeks & television windows other than P5 title games will be included in the following analysis as it’s more relevant to this metric. Bowls have not been included either.
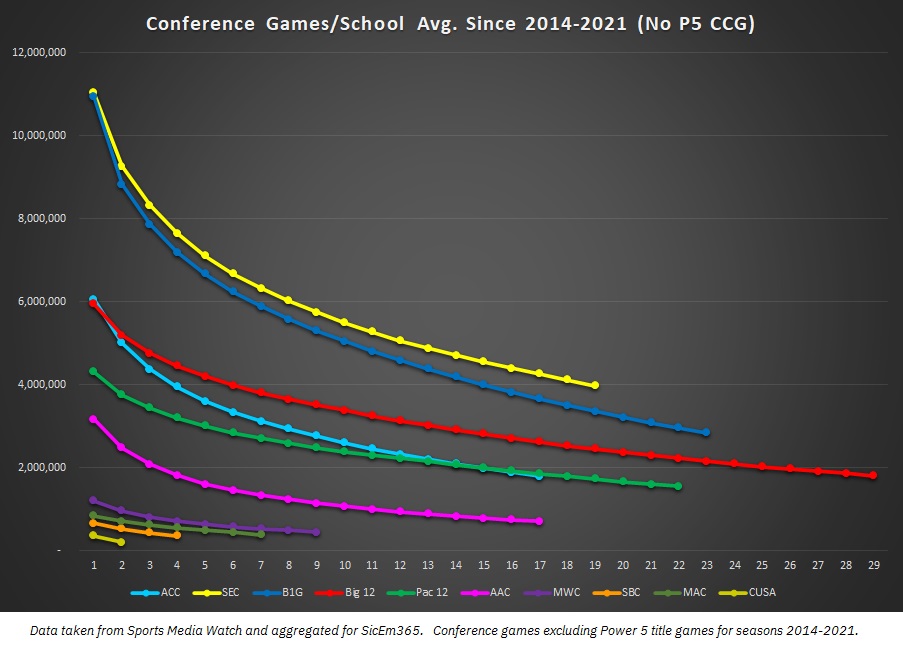
As we can see the SEC is ahead of everyone slightly but the Big Ten is tracking closer with them than most would expect from a simple average since the Big Ten had more games reach nationally rated networks. Next in the hierarchy is the Big 12, as it is neck and neck with the ACC for the top games but the Big 12 pulls away after those. Then it’s the ACC and Pac 12 who trade leads depending on what number of games you sample.
Among the G5 the AAC was the clear leader with the MWC as a clear No. 2. The MAC and Sun Belt took advantage of weeknight windows on ESPN networks to pull ahead of CUSA, who’s tv deal has very few nationally rated games and gets much less exposure.
This ranking is generally the same I’ve seen for individual years over the decade. It’s been the SEC, Big Ten, Big 12, and then depending on the year the ACC or Pac 12 would trade leads. The G5 typically was the AAC, MWC, then everyone else. However, 2021 had one big switch that I had not seen.
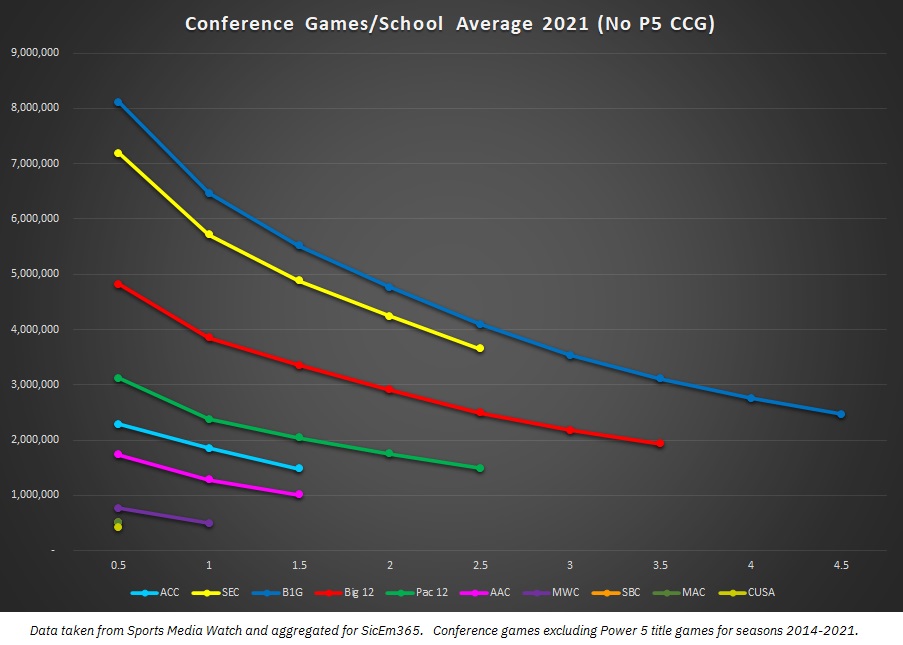
In 2021 the Big Ten actually averaged better than the SEC. Usually, the Big Ten is in shouting range but last year was a complete flip in the data. My best guess is that it was due to a year where LSU, Florida, and Auburn had down years while Michigan, Michigan State, Ohio State, and Penn State all had strong years or at least early parts of the year in the Big Ten East. Additionally, each of the first three also faced Nebraska which is a favorable cross-division draw for TV ratings as the Cornhuskers tend to be a stronger brand than most of their division. This led to more must-see games than usual for one group’s top brands and less than usual for the other’s. Both leagues have solid additional brands like Wisconsin, Tennessee, Penn State, Ole Miss, and others but when you have three of the top five brands in the SEC in a down year it will make an impact.
Additionally, we saw a down year from Clemson, FSU, and Miami. All three didn’t have their best seasons in recent memory, giving them a slip below the Pac 12.
What Does It Look Like After Realignment?
Obviously with Texas, Oklahoma, UCLA, USC, UCF, Houston, BYU, Cincinnati, and several CUSA schools moving around things can look different after realignment. Since these schools were not in a league together it makes for an awkward comparison but I followed these ground rules:
- Schools moving to a P5 conference carry their conference games with them. So Texas vs Oklahoma State helps the SEC line and USC vs Oregon helps the Big Ten line.
- Since the goal is to see how the conferences are performing without their departing members I have omitted P5 games against the departing members. So Texas vs Oklahoma State and USC vs Oregon do not count for the Big 12 and Pac 12. I also extended the “no UT and OU” rule to BYU, UH, Cincy, and UCF.
- Teams joining a league get their games against future league opponents included in the numbers.
- Since it really doesn’t impact the hierarchy, I left in the AAC games where one of the remaining eight AAC schools faced off vs UCF, Cincinnati, and Houston. I also didn’t redo the numbers for CUSA or the Sun Belt since the result is generally similar relative to the MWC and the MAC.
- BYU has no conference to pull conference games from. It’s not a reasonably fair projection to limit BYU to just games against G5 schools or just their P5 opponents since those include games against some giant brands like Michigan, LSU, and a couple of others. To be overly conservative I took their games against Nebraska, Michigan, Texas, USC, UCLA, LSU, Michigan State, Tennessee, and Washington out of the sample. Frankly, it doesn’t matter to the end result — the new Big 12 with all BYU games is slightly above the Pac “10”, virtually even with the PAC if we are ignoring BYU altogether using an 11-team sample, and roughly even-to-slightly-below them using just the games vs the G5 schools or their two games vs Baylor and WVU.
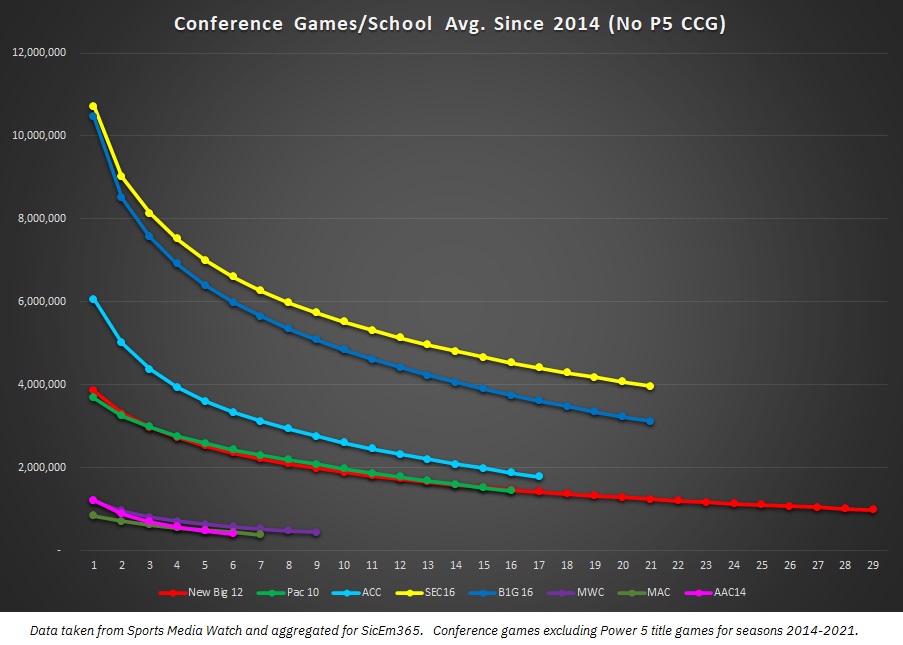
We see that the top two are relatively unchanged but the ACC vaults into third place instead of its annual 4th or 5th variations. The Big 12 and Pac “10” are brought virtually even after the Big 12 had a bigger loss with UT and OU but they started off ahead. However, given more favorable schedules than the AAC schools had and more relevant conference title implications than BYU’s independent schedule provided, it’s reasonable to expect the New Big 12 to perform marginally better than this projection.
The AAC takes a MASSIVE hit in this analysis as 40% of their league is now recent C-USA additions and their television visibility has been minimal on nationally rated networks. The AAC has some top-line games ahead of the MWC but they quickly fall behind after. Rice, UNT, UTSA, Old Dominion, Charlotte, and FAU aren’t coming close to replacing the immediate media draw that the departing three provided.
How Would Expanding Back To 12 Impact the PAC’s Numbers?
With BYU, TCU, and Houston off the board in the last two rounds of realignment you have three of the top former non-power programs in the central time zone or further west unavailable for the Pac 12 to rebuild with. As a result, some combination of San Diego State, Fresno State, SMU, Boise State, or other schools are the possible backfills for USC and UCLA should they expand. All the two team combinations end up similar as they hurt the proportional average relative to standing at ten members the way the Big 12 did in 2016. Below is a look at how hypothetically adding San Diego State and Fresno State would impact this analysis.
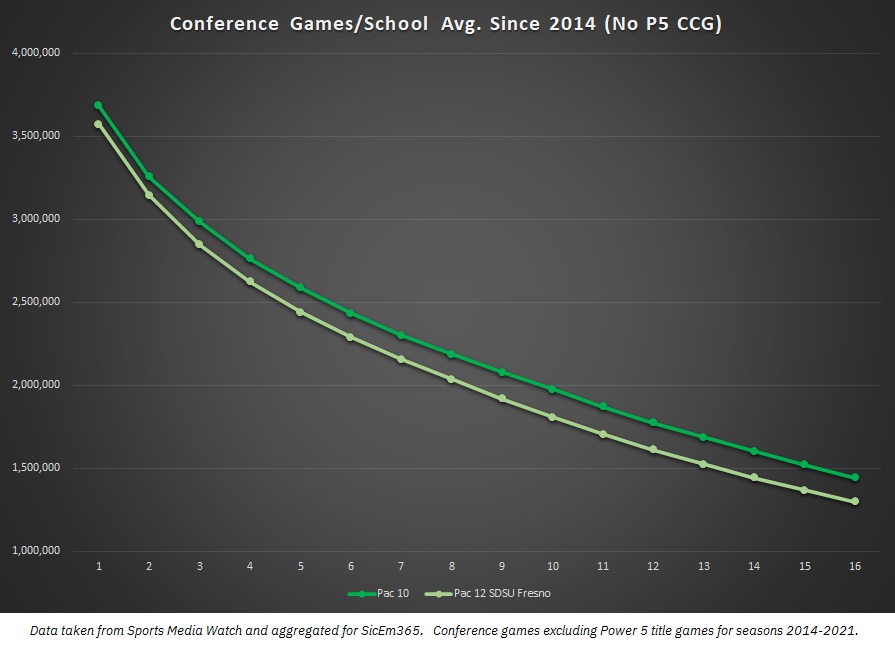
The impact of two schools without many high viewership games hurts the per-school proportional averages. The MWC schools would perform better with a better TV deal and opponents but it’s a clear step back from what they lost.
What If The ACC Lost FSU, Clemson, or Possibly Miami?
With all of the articles out there speculating on the SEC or Big Ten wanting some combination of FSU, Clemson, Miami, North Carolina, UVA, VT, or NC State it’s safe to say there’s at least a decent chance of realignment hitting that league. It would be a dramatic hit to that league. Below we see how an “ACC 12” without FSU and Clemson would perform and how an “ACC 11” without those two or Miami has performed.
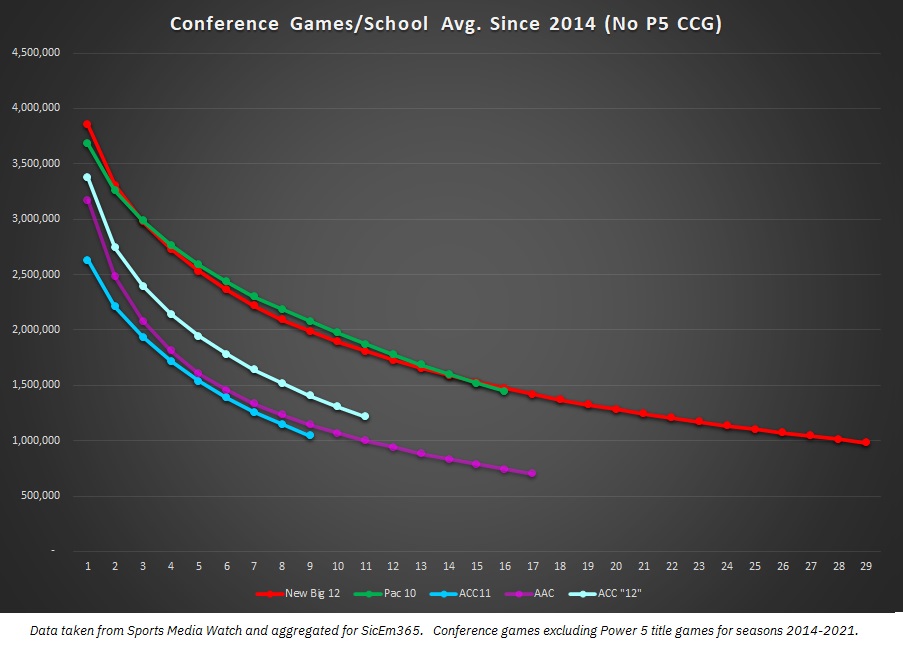
The resulting average isn’t favorable where it falls clearly behind both the new Big 12 and “Pac 10”’s current projected rosters come 2025. Additionally, the sample excluding Miami’s games as well falls behind the 11-team AAC that was anchored by Big 12 additions UCF, Cincinnati, and Houston.
Ultimately television ratings aren’t realignment value but they can give some general indications. Based on these projections I’ve run for several years it isn’t a shock that the SEC and Big Ten are getting such great contracts, and it isn’t shocking that the other three P5 leagues have lost at least one school to one of them. Each has several schools like Alabama, LSU, Auburn, Georgia, and Florida for the SEC and a group of Michigan, Ohio State, Penn State, Nebraska, Michigan State, and Wisconsin for the B1G. Additionally, they each have large state flagships and land grant schools that may not be blue bloods but command strong interest in their entire states like South Carolina, Texas A&M, Ole Miss, Iowa, Minnesota, and Illinois among several more.
My next and final article on television ratings will break down individual school averages and how schools stack up relative to each other. What has the television pecking order been like in the ACC? Who’s on top in the Big Ten? How do recent additions like Nebraska, Louisville, or Texas A&M show in their new conference? We’ll dive into that next time.
Follow @Baylor_S11 on Twitter!

 .
.