The Big 12 is known for offensive success, wide open play, and high scoring games. However 2018 has seen some lower scores and that was apparent with last weekend's collective scoreboards. How have each of the teams changed over the last year? What can it tell us about the season?
Yards Per Drive
Yardage helps contribute to scoring as teams typically need to move the ball a considerable distance to score. I use per-drive statistics to eliminate two biases:
- Teams with fewer possessions and plays get punished by total yards. If a typical drive is around 30 yards it becomes meaningless to compare total yardage from games with 8 possessions to those with 16.
- Yards per play addresses the first concern but biases to teams who hit big plays. For instance Army averaged a strong 48 yards per drive against OU but their 4.4 yards per play would have been 127th nationally as a season average. They moved the ball all day but the per-play stat misses it completely.
For these reasons I try to break down yardage to per-drive statistics. Below you will see several charts with Yards Per Drive.
First I have the average of their YPD from each P5 game compared against "par" which is also defined as what the other P5 offenses averaged against those defenses. Not all opposing schedules challenge an offense as much as others. This tells you how a team did relative to it's schedule. P5 opponents are used so that we provide a reasonable comparison number. Obviously early season samples are smaller so this will shift as the year goes on a little bit.
I also have the background shaded red, yellow and green. Yellow starts roughly where a median national figure or an average national figure end up being; roughly 31 yards per drive. From there it's plus or minus five yards. Assuming a 12-possession game you would have a yardage swing of at least 60 total yards from typical if you fall outside this range. Green is better than five from typical, red is worse than five from there. This tells you if their YPD is good, mediocre, or bad as a stand alone statistic.
The gray bars are each team's "par" while the colored bars are each team. So what did each team do?
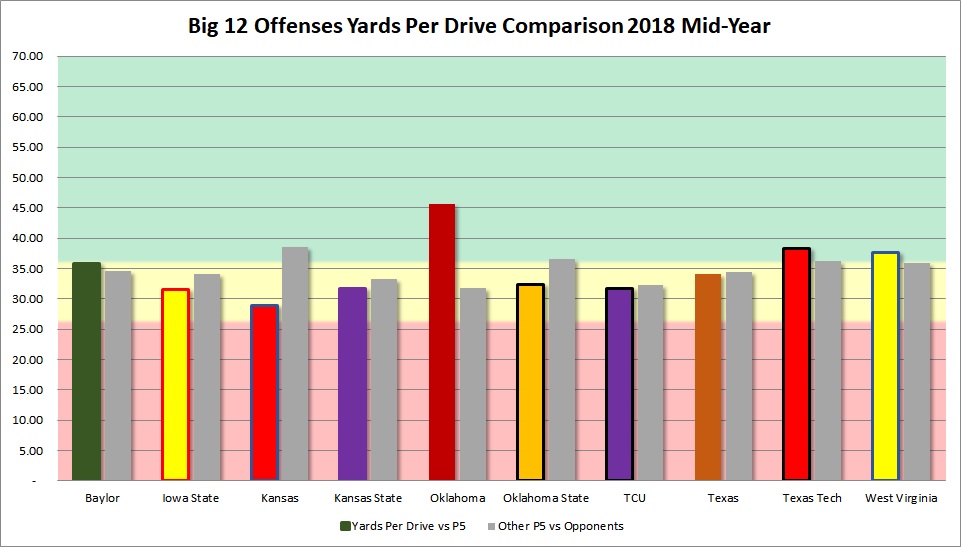
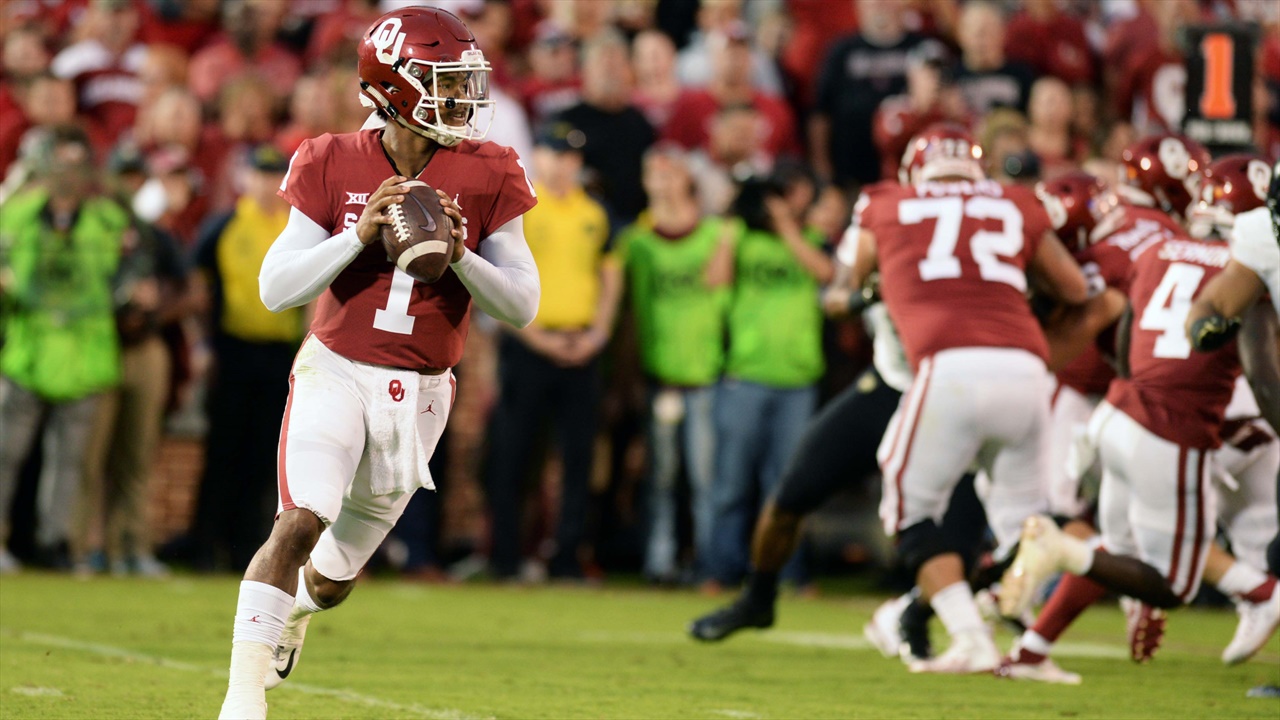
The best offense in the league is Oklahoma and the worst is Kansas which is unchanged from last year. However we've seen OSU significantly struggle which is new. Tech and WVU are probably the next two offenses in the league.
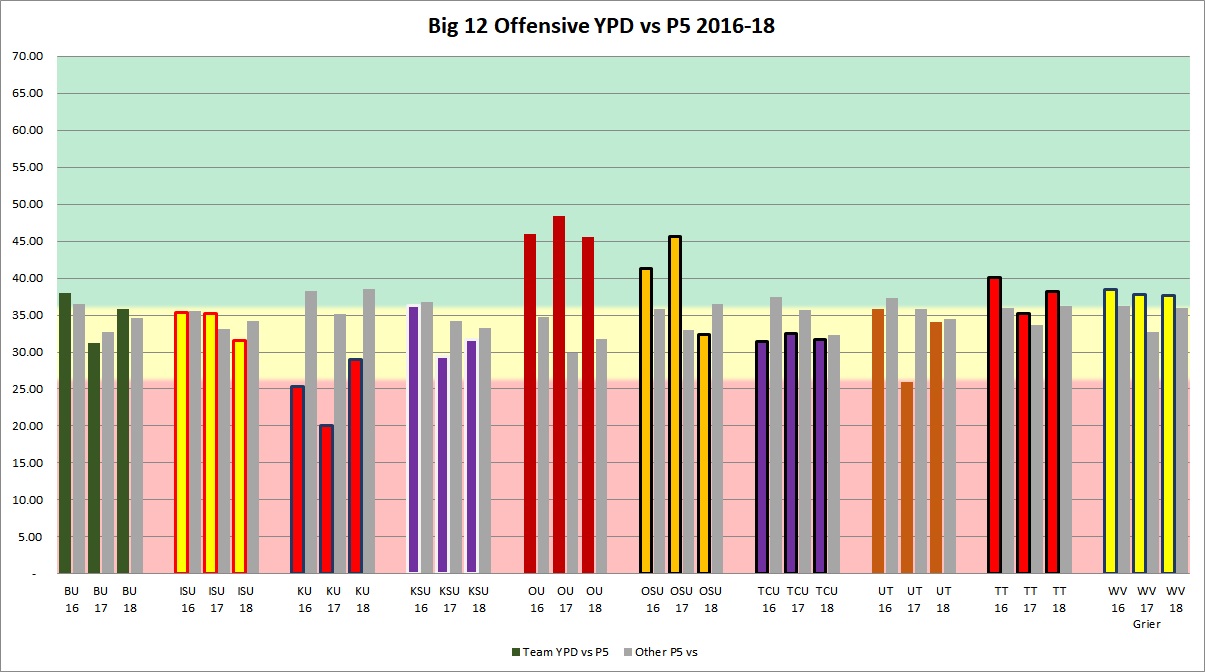
By looking at a three year trend we see how much Baylor and Texas have largely returned to their 2016 performances after a down 2017 and we see how Kansas is improved but still very much struggling. Oklahoma isn't as good as last year was offensively but is outperforming 2016's offense relative to par. TCU, Tech, and WVU are largely in line with their usual performances.
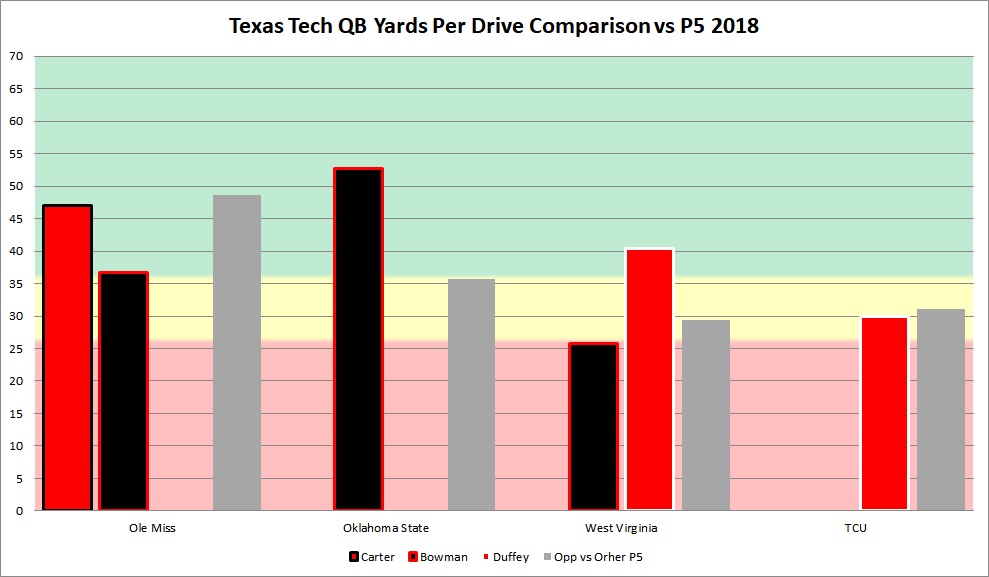
However two teams have not yet completely settled their Quarterback position due to injury. Below I have isolated the two of those. Texas Tech got a good two drives out of McLane Carter against Ole Miss before he got hurt. Bowman played very well against OSU but was below par against the Rebels and Mountaineeers. Duffey did better against WVU and was slightly below par against TCU.
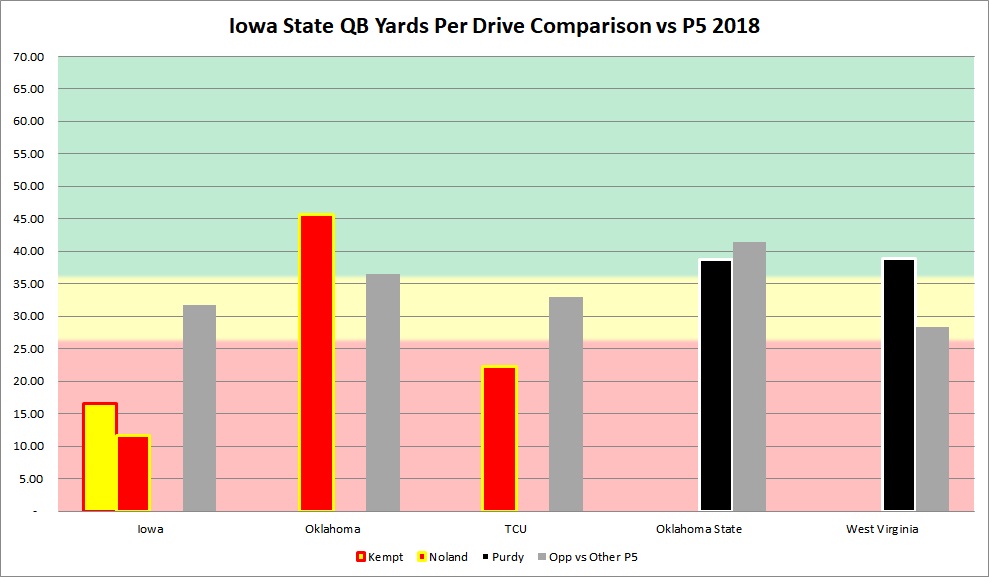
The Cyclones did very little against Iowa and lost Kempt before they played another P5 team. Zeb Noland beat par against OU and underperformed against TCU. Purdy was getting a good YPD number against OSU yet was still below par. He absolutely blew the comparison figure away in the WVU game however.
Red Zone
Yards tell part of the story, but you must convert them to points. Here's how many points each team scored per red zone attempt. Any offensive touchdown is worth 7 points (it would round to that even if I tracked PAT and 2 point attempts) and any made field goal is 3. The yellow band in this chart represents what the middle 33 percent of the country's offenses averaged in points per red zone attempt.
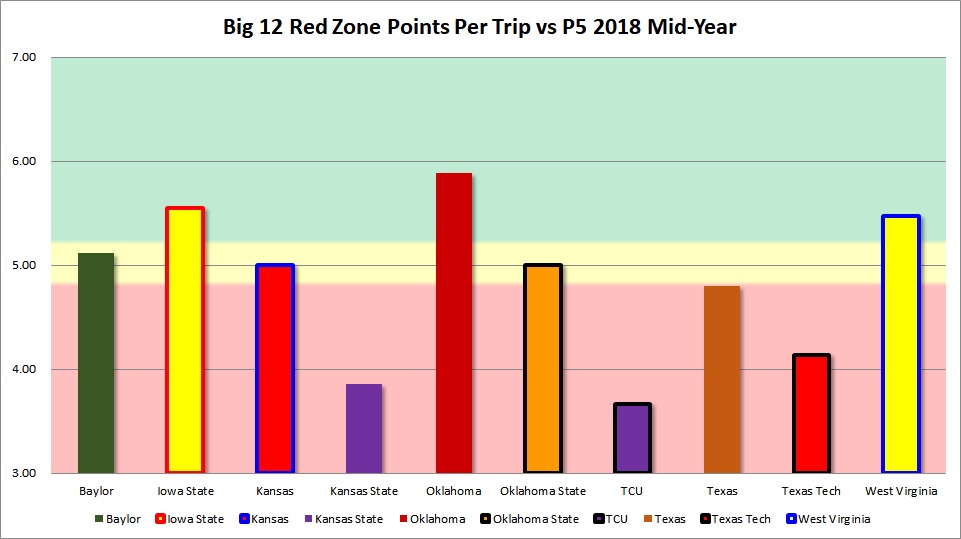
Oklahoma, Iowa State, and West Virginia are the clear winners here. They reliably get points when they move it. Baylor is the other one above median although OSU and KU are close. KSU, Texas Tech, and TCU are not doing well inside the 20.
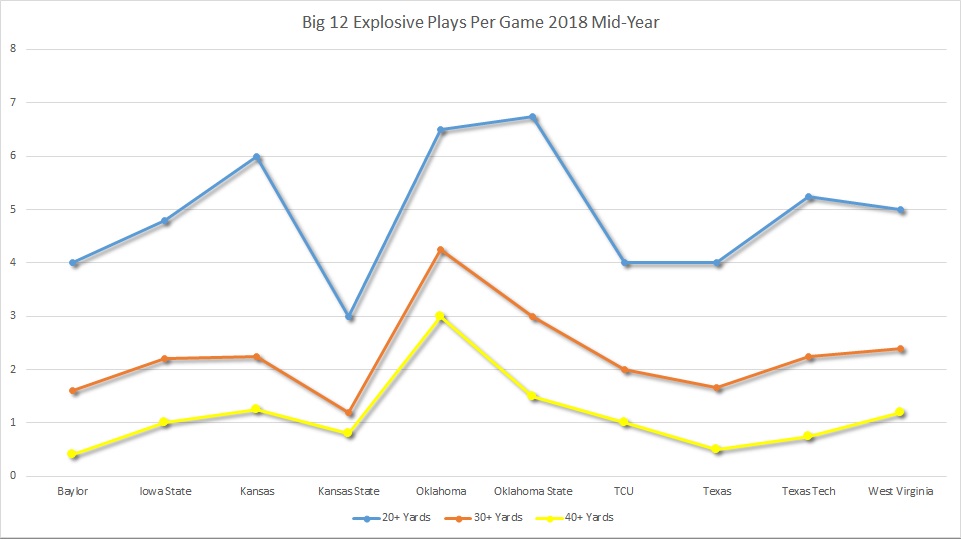
Explosive Plays
What can potentially make red zone play irrelevant on a drive? Big plays. The best offenses in the league for big plays are unsurprisingly Oklahoma, Texas Tech, WVU, and OSU who all run the Air Raid. Kansas is rating high as well but the Rutgers game is really skewing these statistics in their favor and I don't think this will be the case at the end of the year.
Conclusions
So what can we conclude on each team?
- Baylor is moving the ball more efficiently than last fall and converts more points in the red zone after doing a poor job last fall.
- Iowa State hasn't thrived on offense but outside of the Iowa game is mostly hitting par. Their red zone efficiency is strong as you might imagine with tall targets like Butler and the tailback who forces more missed tackles than anyone else.
- Kansas has improved but they aren't close to being average on offense. Despite some good weapons like Steven Sims, Pooka Williams, and Khalil Herbert they aren't getting it done so the OC switch should have been expected.
- Kansas State is largely who they were last year in YPD efficiency but has done better since Thompson became the full time starter although Baylor and OSU aren't among the best defenses in the league. Their red zone numbers must improve as they won't be very explosive most weeks.
- Oklahoma is still an offensive force. They aren't quite what they were in 2017 but clearly they are more than a handful.
- Oklahoma State has been able to hit some big plays against P5 opponents but that's about it. They are not matching par in yardage and they aren't converting abpve average points in the red zone. Obviously their Boise game won't be included in this analysis as Boise isn't P5 and hasn't played any other P5 teams. To say the Pokes lost a lot to graduation is fair.
- TCU is a slightly below par yardage offense but the red zone efficiency they had last year is missing.
- Texas is much better than last fall on offense and while their red zone figures could be better they are no longer far behind the league on explosive plays.
- West Virginia is one of the best league offenses in all three metrics. They are coming off a bad game but will provide a big challenge for defenses.
I will follow up with the defenses in another article.
Follow @Baylor_S11 on Twitter!